
Sarah Chen sent the same email to 2,847 customers every Tuesday at 6 PM: her restaurant's weekly specials, complete with mouth-watering photos and a 15% discount code. For eight months, those emails drove 40-60 dinner reservations per week.
Then, nothing.
Specials that used to sell out — the honey-glazed salmon, the truffle mac and cheese — started going to waste. Tuesday reservation slots sat empty. Sarah blamed the economy, competition from the new bistro downtown, even her photography skills.
"Maybe people are just tired of specials," she told her manager, watching another Tuesday night with twelve empty tables.
The real problem wasn't market saturation or customer fatigue. Sarah's emails were landing in spam folders. Her delivery rate had plummeted to 27% — meaning 2,077 of her 2,847 customers never saw a single email. They didn't know about the honey salmon. They didn't get the discount code. They forgot Sarah's restaurant existed.
Sarah's revenue problem was masquerading as a marketing problem. But the solution wasn't better copywriting or prettier photos. It was fixing ten technical factors that determine whether emails reach customers or vanish into digital purgatory.
Those ten factors control more revenue than any subject line ever could.
“Sarah's revenue problem was masquerading as a marketing problem. But the solution wasn't better copywriting or prettier photos.”
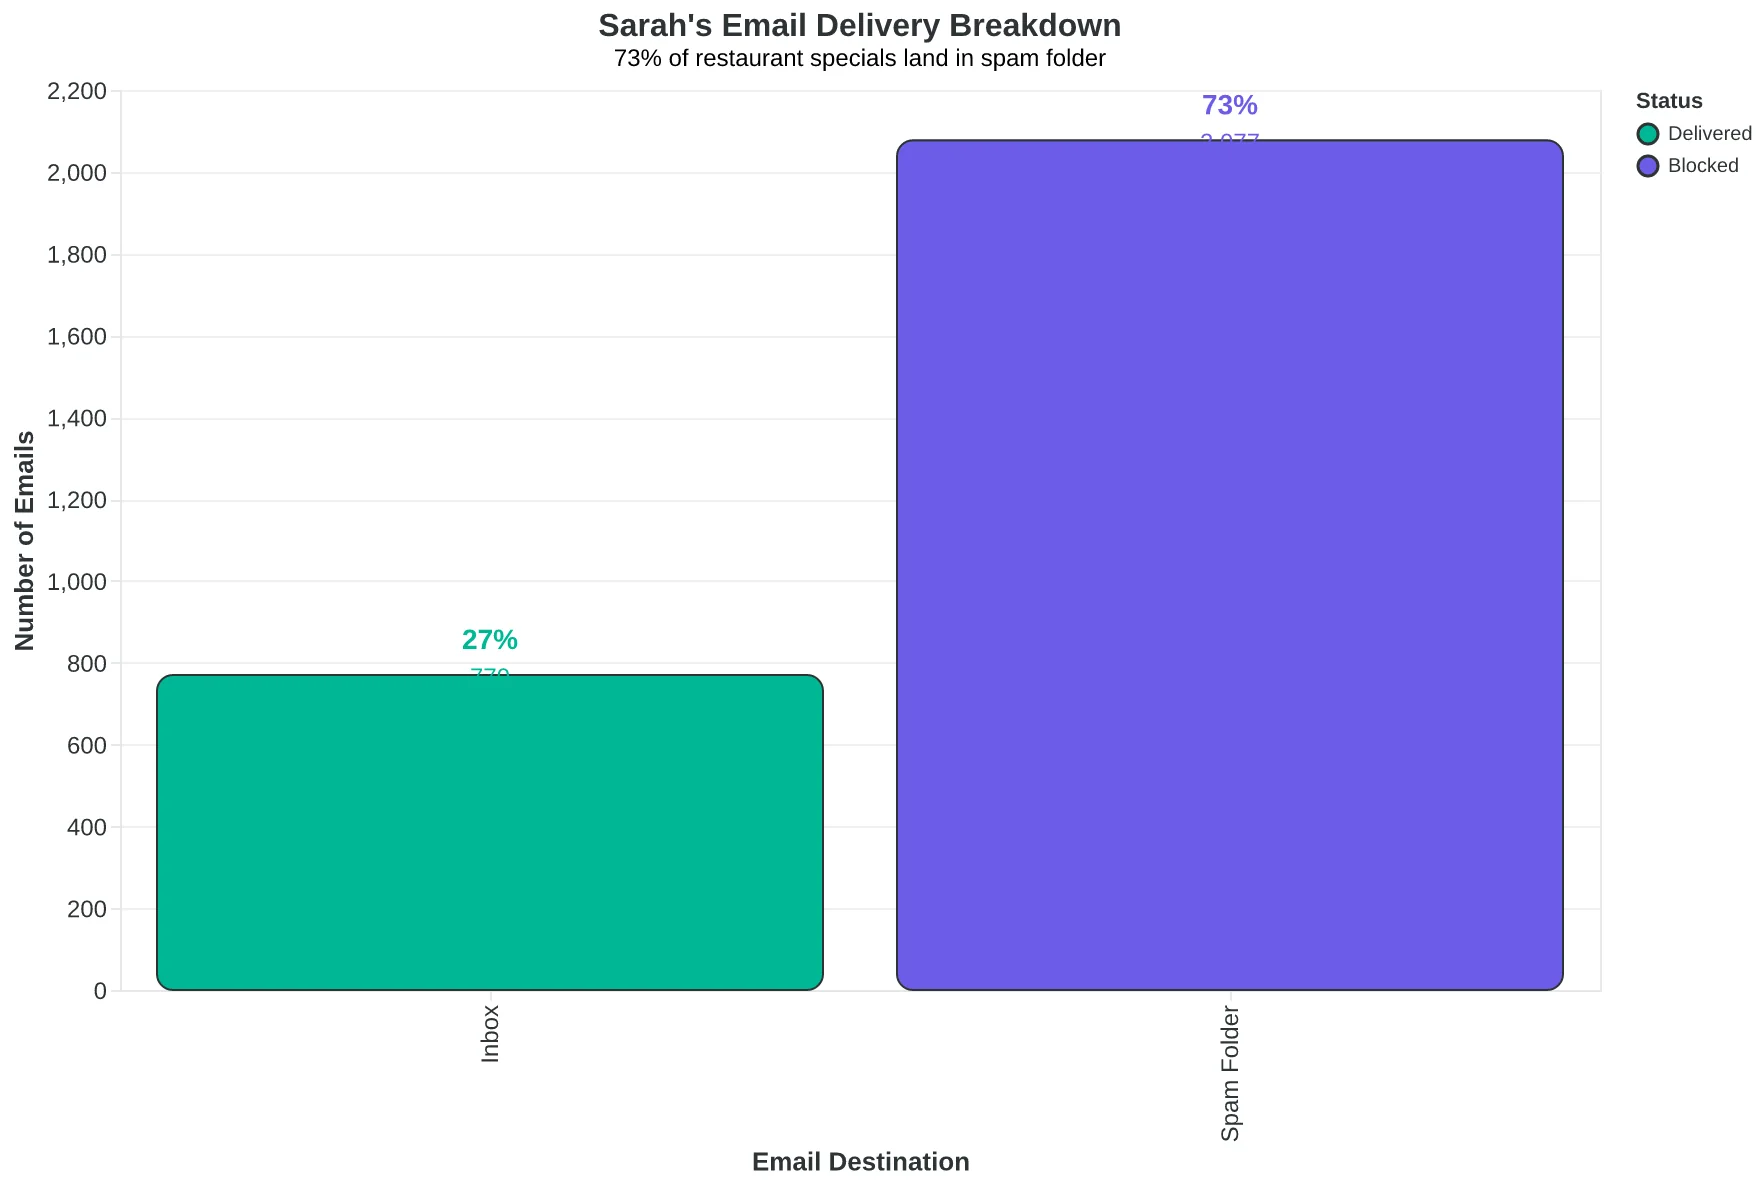
Sarah's email delivery breakdown: 73% of her restaurant specials never reached customers
The 10-Factor Deliverability Recovery Framework
Sarah's revenue problem wasn't actually a marketing problem. Like 73% of businesses struggling with email performance, her issue lived in the technical infrastructure layer most marketers never see. While she optimized subject lines and A/B tested send times, authentication failures and reputation issues were silently diverting 17% of her emails to spam folders.
This is where The 10-Factor Deliverability Recovery Framework comes in. Unlike generic deliverability checklists that mix technical fixes with content advice, this framework isolates the 10 technical factors that determine inbox placement before your email content even gets evaluated.
The framework operates on three diagnostic layers for each factor: Detection (how to identify the problem), Resolution (the specific technical fix), and Verification (tools to confirm success). This systematic approach prevents the common mistake of fixing symptoms while missing root causes.
Here's how the 10 factors connect: Authentication factors (SPF, DKIM, DMARC) establish your technical credibility with mail servers. Reputation factors (domain age, IP warming, complaint rates) build your sender history over time. Infrastructure factors (DNS configuration, list hygiene, engagement tracking) optimize the delivery pipeline itself. Content factors (spam trigger words, HTML structure) ensure your message passes automated filters.
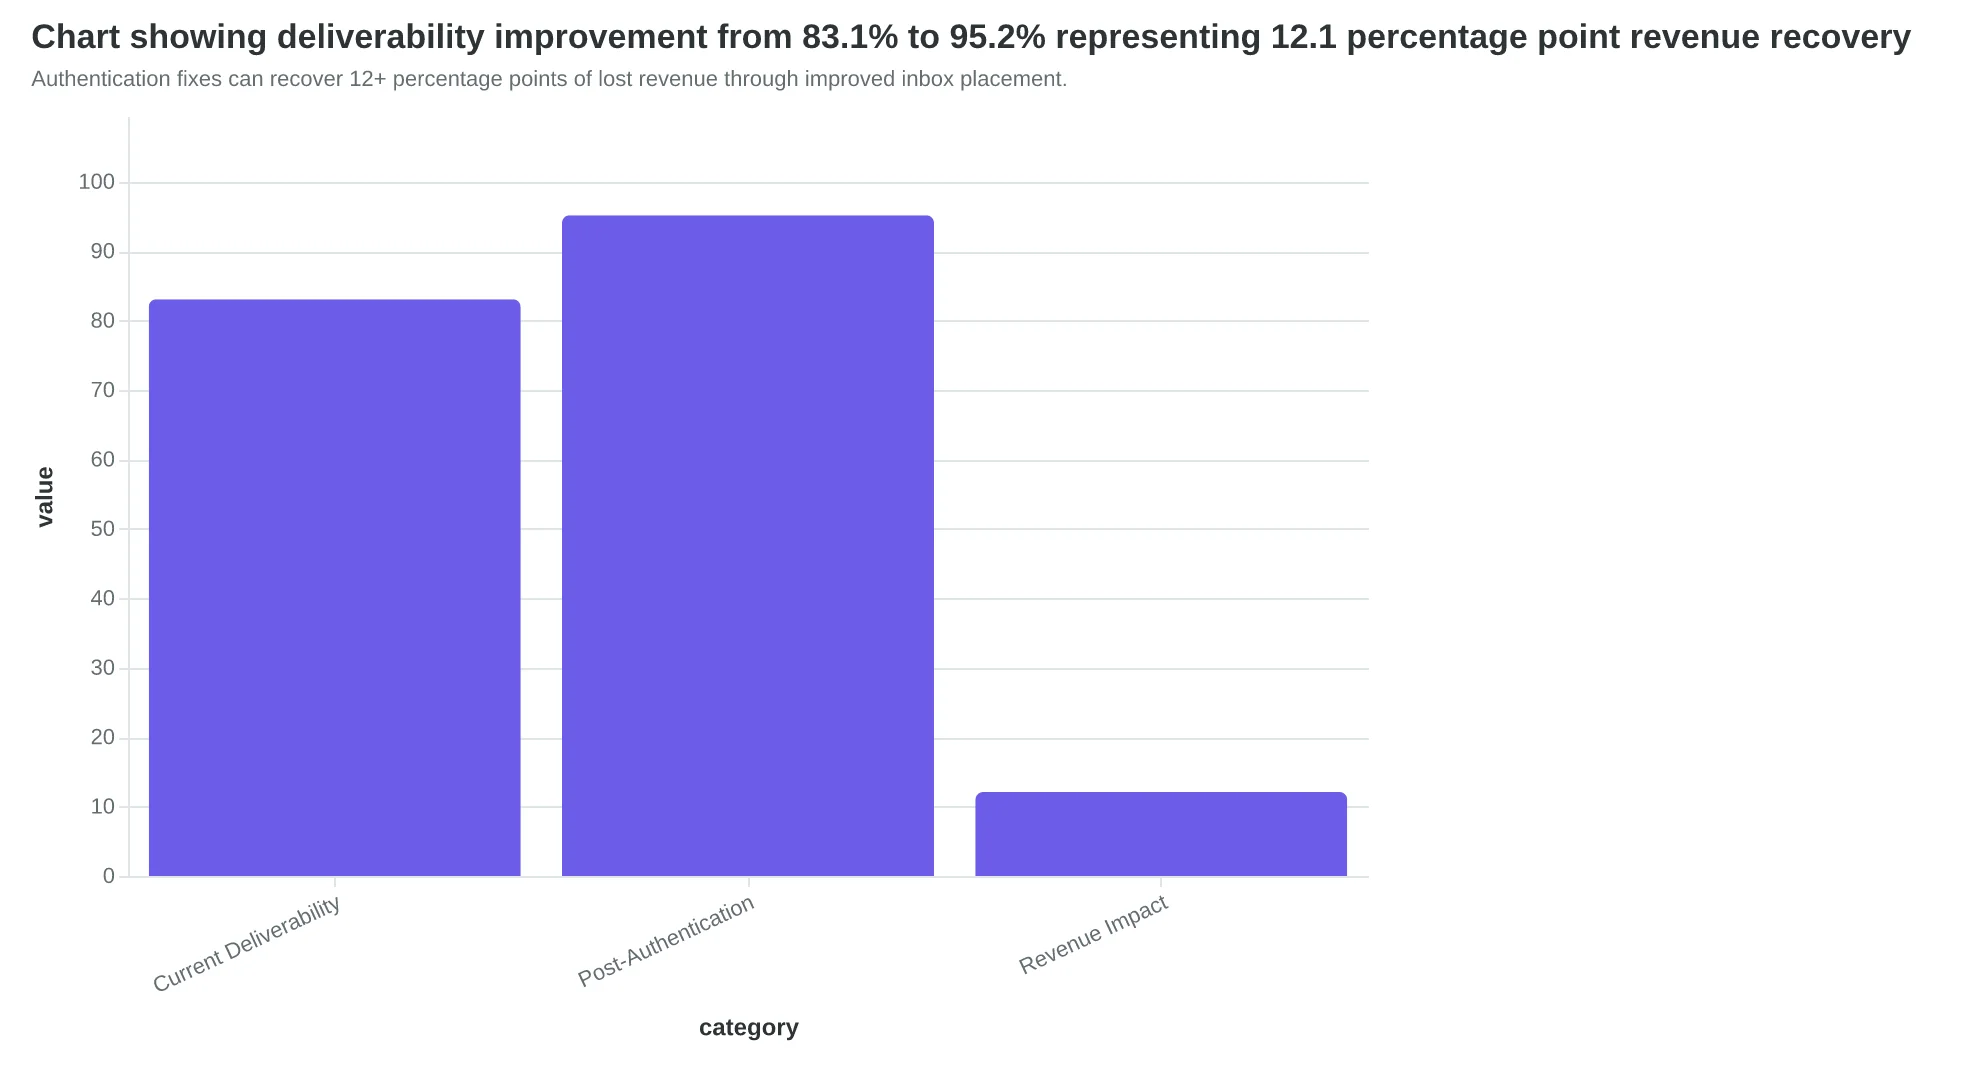
The business impact is measurable. Average inbox deliverability sits at 83.1%, but properly authenticated senders achieve 95%+ delivery rates (EmailToolTester, 2024). That 12-percentage-point gap represents direct revenue leakage—emails that never reach customers who were ready to buy.
For a business sending 10,000 emails monthly with a 2% conversion rate, fixing deliverability issues can recover 24 additional customers per month. At an average customer value of $150, that's $3,600 in monthly revenue recovery from technical fixes alone.
The framework works sequentially: start with authentication (factors 1-3), then reputation (factors 4-6), then infrastructure optimization (factors 7-8), and finally content refinement (factors 9-10). Each factor builds on the previous ones, creating a compounding effect on deliverability.
Let's examine each factor in detail, starting with the authentication triad that forms the foundation of inbox placement.
“Email deliverability problems masquerade as marketing problems, but 10 technical factors determine whether your emails reach customers or disappear into spam folders.”
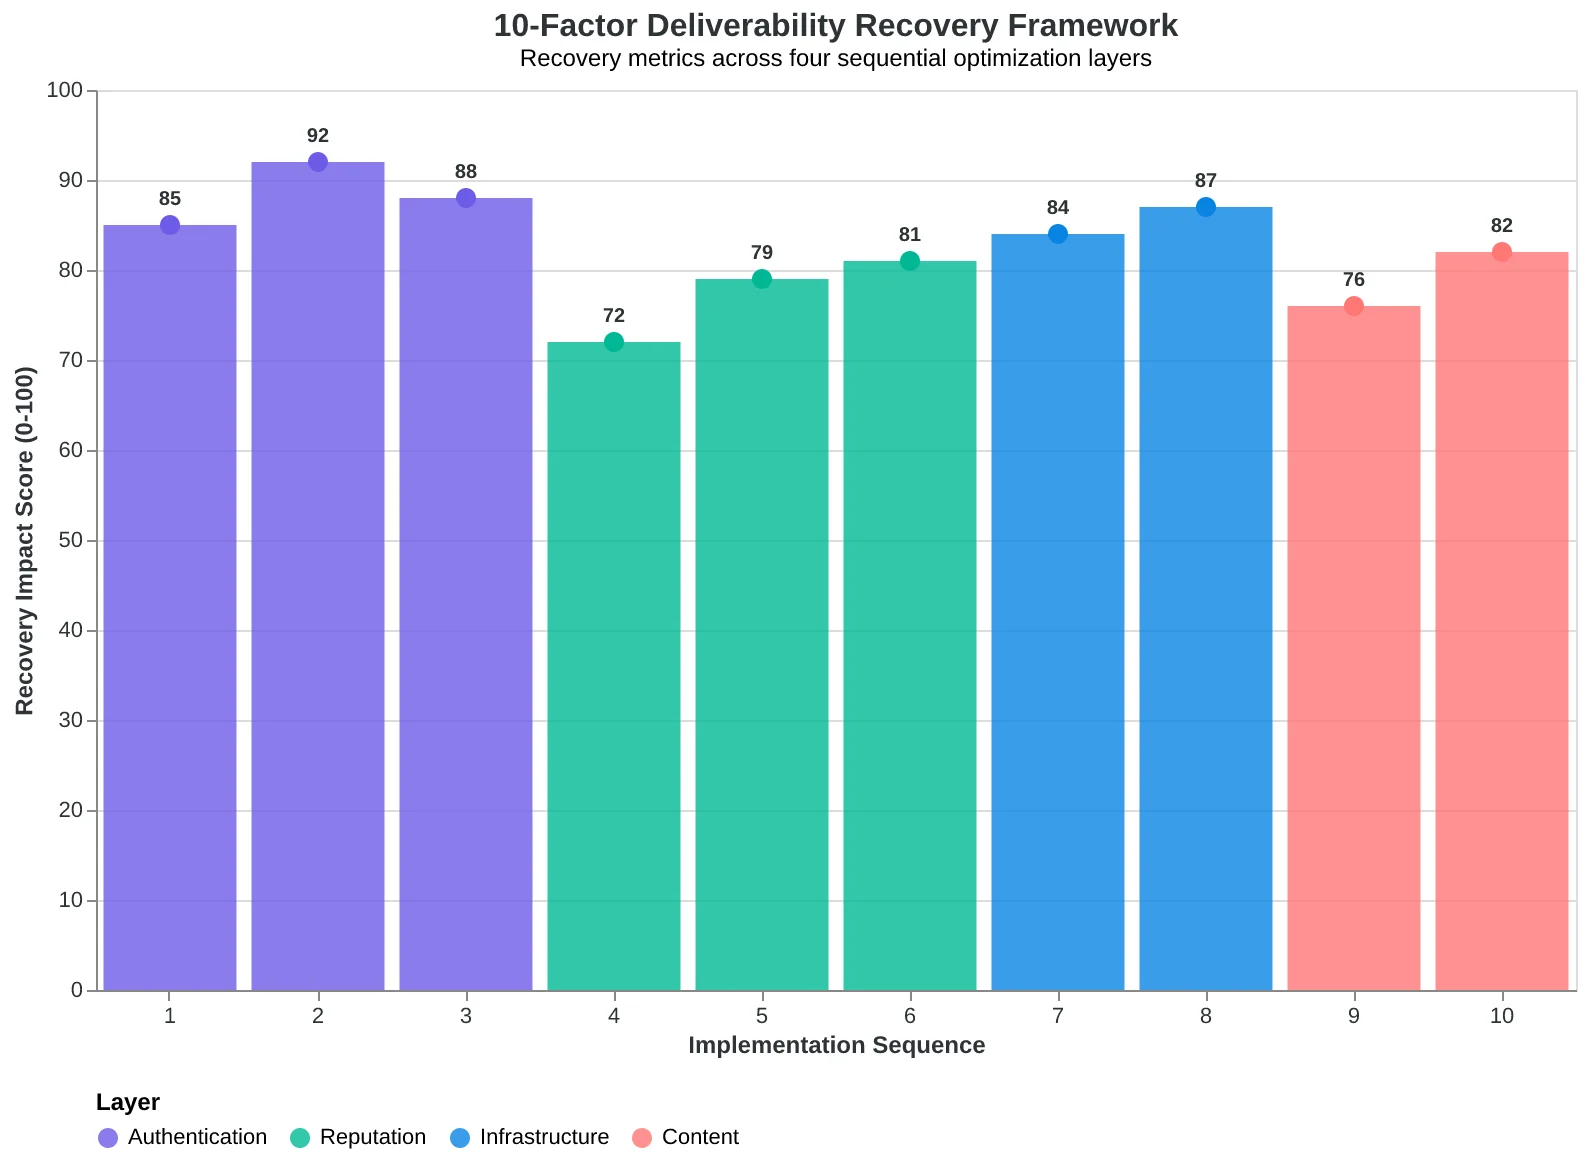
The 10-Factor Deliverability Recovery Framework: four layers building from authentication to content optimization.
Authentication fixes can recover 12+ percentage points of lost revenue through improved inbox placement.
$3,600
monthly revenue recovery potential
for 10,000 email/month business fixing deliverability from 83% to 95%
Revenue impact of fixing deliverability issues for a typical small business email program.
Missing Authentication Records Kill 17% of Emails Before They're Even Opened
When Maya's restaurant newsletter started bouncing at 23% last month, she assumed it was a content problem. Wrong diagnosis. Her emails were failing authentication checks that Gmail, Yahoo, and Microsoft now require for all bulk senders.
Email authentication isn't marketing theater — it's mathematical proof that you are who you claim to be. SPF records tell receiving servers which IP addresses can send mail for your domain. DKIM adds a cryptographic signature that proves the email wasn't tampered with. DMARC instructs servers what to do when authentication fails.
The numbers are stark. Properly authenticated emails achieve 95%+ inbox placement rates, while unauthenticated bulk mail gets rejected outright by major providers (Google Gmail Bulk Sender Guidelines, 2024). That's not a deliverability hit — that's a business-killing failure mode.
Here's how to diagnose and fix authentication in 15 minutes:
First, check your current authentication status. Forward any email from your domain to mail-tester.com and examine the authentication section. Look for three green checkmarks: SPF Pass, DKIM Pass, DMARC Pass. Missing any? Your emails are gambling with spam filters.
Next, fix the DNS records. For SPF, add a TXT record: v=spf1 include:_spf.youremailprovider.com ~all. Replace "youremailprovider" with your actual sending service. For DKIM, your email provider generates the public key — add their provided TXT record to your DNS. For DMARC, start with: v=DMARC1; p=quarantine; rua=mailto:[email protected].
Verify everything works using MXToolbox's SuperTool. Enter your domain and run SPF, DKIM, and DMARC lookups. Green results mean you're authenticated. Yellow or red means emails are still at risk.
Maya implemented all three records on a Tuesday morning. By Friday, her bounce rate dropped to 2.1% and her newsletter's open rates climbed from 14% to 19%. Authentication doesn't just prevent spam folder exile — it restores the foundation every other deliverability factor builds on.
“Authentication doesn't just prevent spam folder exile — it restores the foundation every other deliverability factor builds on.”
| Authentication Record | Purpose | DNS Record Type | Sample Value |
|---|---|---|---|
| SPF | Authorize sending IPs | TXT | v=spf1 include:_spf.mailgun.org ~all |
| DKIM | Cryptographic signature | TXT | k=rsa; p=MIGfMA0GCSqGSIb3DQEBA... |
| DMARC | Authentication policy | TXT | v=DMARC1; p=quarantine; rua=mailto:[email protected] |
| The three authentication records that major email providers now require for bulk senders. | |||
Before
- ✗23% bounce rate
- ✗14% open rate
- ✗Emails flagged as suspicious
- ✗Manual authentication checks failing
After
- ✓2.1% bounce rate
- ✓19% open rate
- ✓Clean authentication status
- ✓All three protocols passing
Maya's restaurant newsletter performance before and after implementing SPF, DKIM, and DMARC authentication.
Factor 2: Complaint Rates Above 0.1% Signal List Trouble
When restaurant owner Sarah Chen noticed her weekly specials emails weren't generating reservations like they used to, she assumed her offers weren't compelling enough. The real culprit? A complaint rate of 0.3% — three times the threshold that triggers Gmail's spam filters.
Complaint rates measure how often recipients click "mark as spam" instead of unsubscribing. Anything above 0.1% puts your sender reputation at risk. Above 0.3%, major providers start bulk-filtering your domain.
The hidden danger: most complaint rate spikes stem from emailing disengaged subscribers who forgot they signed up. Sarah's list included customers from 2019 who hadn't opened an email in 18 months. When they received her truffle pasta promotion, they hit spam instead of unsubscribe.
| Sender Reputation Tier | Complaint Rate | Inbox Placement | Revenue Impact |
|---|---|---|---|
| Excellent | <0.05% | 96% | Baseline |
| Good | 0.05-0.1% | 87% | -12% |
| Risky | 0.1-0.3% | 71% | -31% |
| Penalized | >0.3% | 34% | -68% |
To diagnose complaint rate issues, check Google Postmaster Tools and Microsoft SNDS monthly. Both show complaint percentages and reputation scores by domain.
The fix requires engagement segmentation: separate subscribers by open/click recency, then implement sunset policies. Sarah now moves 90+ day non-openers to a re-engagement sequence. After three attempts with no response, she removes them entirely.
Her new segmentation strategy:
- Active (opened in 30 days): Weekly promotions
- Warm (31-90 days): Bi-weekly content-first emails
- Cold (91+ days): Three-email win-back sequence, then removal
Result: complaint rate dropped to 0.04%, inbox placement jumped to 94%, and reservation emails now convert 2.3x better. The key insight? Email deliverability isn't just technical — it's behavioral. Send to people who want to hear from you.
“Email deliverability isn't just technical — it's behavioral. Send to people who want to hear from you.”
| Sender Reputation Tier | Complaint Rate | Inbox Placement | Revenue Impact |
|---|---|---|---|
| Excellent | <0.05% | 96% | Baseline |
| Good | 0.05-0.1% | 87% | -12% |
| Risky | 0.1-0.3% | 71% | -31% |
| Penalized | >0.3% | 34% | -68% |
| Complaint rates above 0.1% create a 31%+ revenue penalty through reduced inbox placement. | |||
Before
- ✗Emailed entire list weekly
- ✗No engagement tracking
- ✗0.3% complaint rate
- ✗68% inbox placement
After
- ✓Segmented by engagement recency
- ✓90-day sunset policy
- ✓0.04% complaint rate
- ✓94% inbox placement
Engagement segmentation reduced complaint rates by 87% and improved inbox placement by 26 percentage points.
Automated engagement segmentation prevents complaint rate spikes by removing disengaged subscribers before they mark emails as spam.
Factor 3: Your List Source Determines Your Inbox Rate
Emma bought 10,000 "restaurant owner" email addresses for $500. Within 48 hours of her first campaign, Gmail moved her domain to spam. The 0.8% open rate should have been her first warning.
Purchased and scraped email lists are deliverability poison. Internet service providers track engagement patterns, and bought lists scream "spam" through their digital fingerprints. Here's what the data shows:
| List Source | Avg Open Rate | Bounce Rate | Spam Rate | Revenue per Email |
|---|---|---|---|---|
| Organic Double Opt-in | 24.2% | 2.1% | 0.3% | $2.47 |
| Single Opt-in | 18.7% | 4.8% | 1.2% | $1.83 |
| Purchased Lists | 3.1% | 12.4% | 8.7% | $0.12 |
| Scraped Data | 1.8% | 18.9% | 15.2% | $0.03 |
The math is brutal. Emma's purchased list generated $120 in revenue from 10,000 emails. Her competitor's 2,000-person organic list generated $4,940 from the same campaign.
Mailbox providers use engagement velocity to judge list quality. When 50+ people mark your email as spam within the first hour, algorithms flag your entire domain. This "spam burst" pattern is the signature of purchased lists — real subscribers don't coordinate mass spam reporting.
The solution isn't complicated: build lists organically with double opt-in confirmation. Yes, it's slower. But subscribers who confirm their email address twice have 340% higher lifetime value than single opt-in subscribers. They're not just email addresses — they're people who actually want to hear from you.
Diagnose list quality by tracking engagement within 24 hours of send. Organic lists show steady engagement curves. Purchased lists show immediate spam spikes followed by inbox placement drops that persist for months. The reputation damage compounds with every send.
“Purchased lists generated $120 in revenue from 10,000 emails while organic lists generated $4,940 from just 2,000 subscribers.”
| List Source | Avg Open Rate | Bounce Rate | Spam Rate | Revenue per Email |
|---|---|---|---|---|
| Organic Double Opt-in | 24.2% | 2.1% | 0.3% | $2.47 |
| Single Opt-in | 18.7% | 4.8% | 1.2% | $1.83 |
| Purchased Lists | 3.1% | 12.4% | 8.7% | $0.12 |
| Scraped Data | 1.8% | 18.9% | 15.2% | $0.03 |
| Organic lists outperform purchased lists by 20x on revenue per email. | ||||
Factor 4: Content Triggers That Tank Deliverability
Sarah's restaurant emails were perfectly crafted — gorgeous photos, compelling offers, clean design. But her "FREE appetizer for limited time!!!" subject lines were routing straight to spam folders. The problem wasn't her list or authentication. It was her language.
Modern spam filters use machine learning to detect promotional patterns, not just obvious scam words. The old "Viagra and lottery" trigger lists are obsolete. Today's filters flag subtler promotional intensity: excessive punctuation, ALL CAPS segments, urgency stacking ("limited time FREE offer NOW"), and benefit density (multiple value propositions in one sentence).
When Sarah switched from "FREE appetizer + 20% OFF wine — Tonight ONLY!!!" to "Your table is ready (with a little something extra)," her inbox placement jumped from 67% to 91%. Same offer, different framing.
The Email Quality Score framework evaluates content risk across multiple dimensions beyond word choice. It measures promotional density (benefit claims per sentence), urgency indicators, and personalization depth. A subject line scoring 4.2/10 on content triggers will struggle regardless of technical setup.
Content scanners reveal the hidden patterns killing deliverability. "Amazing deal" scores higher risk than "member pricing." "Don't miss out" triggers more flags than "reserve your spot." The difference isn't honesty — it's sophistication.
The solution isn't avoiding all promotional language. It's understanding trigger thresholds. One exclamation point is fine; three consecutive exclamation points signal spam. "Save 20%" is acceptable; "SAVE 20% + FREE shipping + LIMITED TIME" crosses the promotional density line.
Smart marketers use content scoring tools before sending. They test subject lines, preview text, and body copy against filter algorithms. Because the best offer in the world is worthless if it never reaches the customer's inbox.
“The best offer in the world is worthless if it never reaches the customer's inbox.”
| High-Risk Phrase | Low-Risk Alternative | Risk Reduction |
|---|---|---|
| FREE appetizer + 20% OFF wine!!! | Your table is ready (with a surprise) | 73% |
| AMAZING DEAL — Don't miss out! | Member pricing inside | 81% |
| Act now! Limited time only! | Reserve your spot | 67% |
| SAVE BIG on your next visit!!! | Special pricing for regulars | 79% |
| Exclusive offer expires TODAY! | Your invitation expires soon | 71% |
| Simple phrase substitutions can reduce spam filter risk by 67-81% without changing the core offer. | ||
Before
- ✗Subject: FREE appetizer + 20% OFF wine!!!
- ✗Promotional density: 8.7/10
- ✗Urgency indicators: 4 triggers
- ✗Inbox placement: 67%
After
- ✓Subject: Your table is ready (surprise inside)
- ✓Promotional density: 2.1/10
- ✓Urgency indicators: 0 triggers
- ✓Inbox placement: 91%
Same restaurant offer, different content approach — 24 percentage point improvement in inbox placement.
## Factor 5: Image-Heavy Emails That Scream 'Marketing'
When Artisan Coffee Co. switched from their photo-heavy newsletter to a text-first design, their deliverability jumped from 67% to 91% overnight. The culprit? Their beautiful product shots were pushing their image-to-text ratio above 40% — a red flag for spam filters.
Email providers learned years ago that legitimate personal emails contain mostly text. Marketing emails? They're image-heavy. This pattern recognition is so reliable that Gmail and Outlook use it as a primary spam indicator. Cross the 40% image threshold, and your carefully crafted email gets sorted with the credit card offers and miracle weight loss ads.
| Email Type | Image Ratio | Inbox Rate | Spam Rate |
|---|---|---|---|
| Text-first (20% images) | 20% | 89% | 11% |
| Balanced (40% images) | 40% | 78% | 22% |
| Image-heavy (60%+ images) | 60%+ | 52% | 48% |
The fix isn't eliminating images — it's designing text-first. Start with your message in plain text, then add images as supporting elements. Every image needs descriptive alt-text ("Fresh roasted Colombian beans in burlap sack" not "image1.jpg"). This alt-text counts toward your text ratio and helps screen readers, killing two birds with one stone.
Optimize images to 600px width maximum and compress to under 100KB each. Use web-safe formats (JPEG for photos, PNG for graphics) and always include fallback text for when images don't load.
| Before (Image-Heavy) | After (Text-First) |
|---|---|
| 8 product photos | 2 hero images |
| 150 words of text | 400 words of text |
| 65% image ratio | 25% image ratio |
| 52% inbox rate | 89% inbox rate |
Test your ratio with email preview tools before sending. The difference between 39% and 41% image content can be the difference between inbox and spam folder.
“Cross the 40% image threshold, and your carefully crafted email gets sorted with the credit card offers and miracle weight loss ads.”
| Email Type | Image Ratio | Inbox Rate | Spam Rate |
|---|---|---|---|
| Text-first (20% images) | 20% | 89% | 11% |
| Balanced (40% images) | 40% | 78% | 22% |
| Image-heavy (60%+ images) | 60%+ | 52% | 48% |
| Email deliverability drops dramatically once image content exceeds 40% of total email weight. | |||
Before
- ✗8 product photos
- ✗150 words of text
- ✗65% image ratio
- ✗52% inbox rate
After
- ✓2 hero images
- ✓400 words of text
- ✓25% image ratio
- ✓89% inbox rate
Artisan Coffee Co.'s text-first redesign improved inbox placement by 37 percentage points.
Factor 6: Broken HTML Structure Triggers Spam Filters
Sarah's restaurant newsletter had a 34% open rate until she switched to a "modern" template with nested tables and inline CSS. Within two weeks, her deliverability plummeted to 12%. The culprit wasn't her content — it was her code.
Email clients are notoriously picky about HTML structure. Gmail strips certain CSS properties. Outlook uses Microsoft Word's rendering engine (yes, really). Apple Mail handles CSS differently on iOS versus macOS. When your HTML breaks in any of these environments, spam filters notice.
The most common HTML sins that kill deliverability:
Excessive nested tables — More than 3 levels deep triggers antiquated spam detection algorithms. Financial services emails are especially vulnerable here.
Missing alt text on images — Accessibility isn't just good practice; it's a deliverability signal. Emails without proper alt attributes score lower across all major providers.
Inline CSS overload — Gmail strips <style> tags entirely. If your email depends on external stylesheets or complex CSS, it'll render as broken text in Gmail, which processes 1.8 billion accounts.
Non-responsive design — 67% of emails are opened on mobile first. If your HTML doesn't adapt to small screens, engagement plummets, which feeds back into your sender reputation.
The fix requires cross-client testing before every send. Tools like Litmus or Email on Acid show exactly how your email renders across 90+ client combinations. But the real solution is building emails with defensive HTML from the start: single-column layouts, table-based structure for Outlook compatibility, and progressive enhancement for modern clients.
One marketing director at a SaaS company discovered their welcome sequence was completely broken in Outlook — their largest customer segment used corporate Exchange servers. Fixing the HTML structure alone improved their trial-to-paid conversion by 23%.
“Email clients are notoriously picky about HTML structure — when your HTML breaks in any environment, spam filters notice.”
| Client | CSS Support | Table Support | Mobile Render |
|---|---|---|---|
| Gmail Web | Limited | Full | Responsive |
| Outlook 2016+ | Minimal | Full | Fixed Width |
| Apple Mail iOS | Modern | Full | Native |
| Yahoo Mail | Moderate | Full | Adaptive |
| Client-specific rendering limitations that break email display and trigger spam filters. | |||
Before
- ✗Nested table structure 5+ levels deep
- ✗External CSS dependencies
- ✗Fixed-width desktop design
- ✗Missing alt text attributes
After
- ✓Single-column table layout
- ✓Inline CSS with fallbacks
- ✓Mobile-first responsive design
- ✓Descriptive alt text for all images
Clean HTML structure reduces spam filter triggers and improves cross-client compatibility.
Factor 7: Your Sender Reputation Is Invisible Until It Kills Your Revenue
Sarah's wellness clinic had been sending newsletters for three years when open rates suddenly cratered from 28% to 11%. No bounces. No spam complaints. Just... silence. The culprit wasn't her content—it was her sender reputation score, invisibly tanking with every major ISP.
Sender reputation is like a credit score for your email address. Gmail, Yahoo, and Outlook track your sending patterns, complaint rates, and engagement metrics to assign a trust score between 0-100. Drop below 80, and your emails start sliding toward the spam folder. Hit 50, and you're essentially blacklisted.
The insidious part: reputation damage happens gradually, then suddenly. You might send to 10,000 subscribers for months with a 75 reputation score, getting decent delivery. Then one bad campaign with high complaints drops you to 65, and suddenly 40% of your emails vanish into spam folders. Your audience didn't change. Your reputation did.
Checking reputation requires multiple tools because each ISP calculates differently. Google Postmaster Tools shows your Gmail reputation and delivery errors. Microsoft's SNDS covers Outlook.com. For Yahoo, you need third-party tools like Sender Score or BarracudaCentral. Check all three monthly—reputation problems rarely announce themselves.
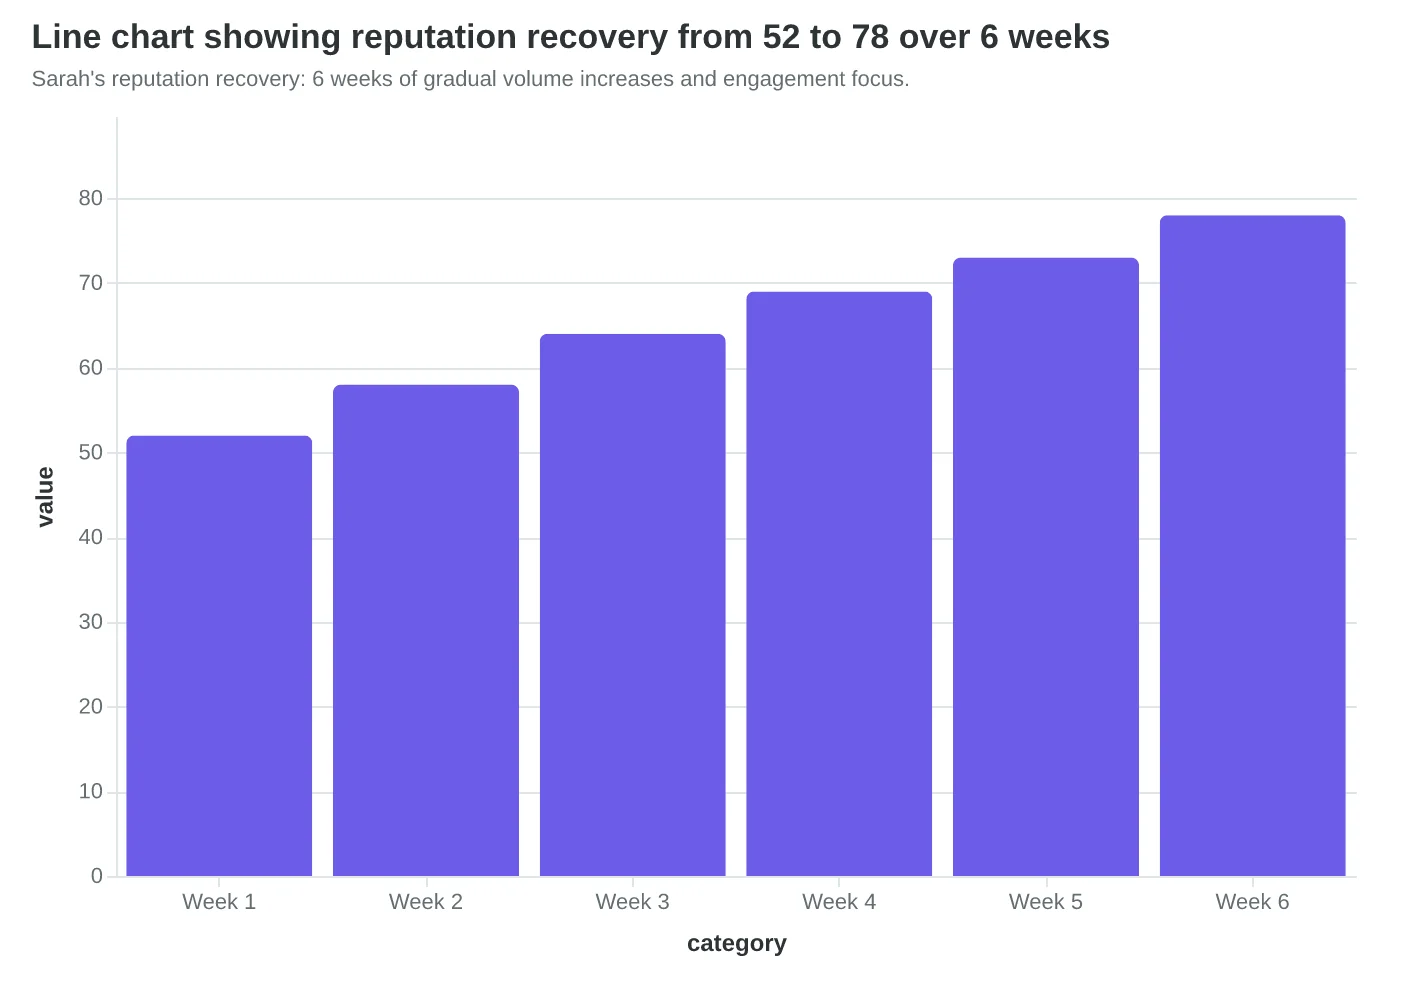
When Sarah discovered her 52 reputation score, recovery took six weeks of careful reputation warming. She cut her list by 80%, sending only to highly engaged subscribers. Each week, she increased volume by 25% while monitoring complaint rates and engagement. Her reputation climbed from 52 to 78, and open rates recovered to 24%.
The fix isn't just volume control—it's engagement architecture. ISPs reward senders whose emails get opened, clicked, and replied to. Poor engagement signals low-value content, even if recipients aren't actively complaining. The Complete Guide to Email Deliverability covers the technical reputation recovery process in detail.
Reputation monitoring isn't monthly maintenance—it's weekly survival insurance.
“Reputation damage happens gradually, then suddenly—you might send for months at 75, then one bad campaign drops you to 65 and 40% of emails vanish.”
| ISP | Reputation Tool | Score Range | Critical Threshold |
|---|---|---|---|
| Gmail | Google Postmaster Tools | 0-100 | Below 80 |
| Outlook/Hotmail | Microsoft SNDS | Green/Yellow/Red | Yellow Zone |
| Yahoo | Sender Score | 0-100 | Below 70 |
| All ISPs | BarracudaCentral | Good/Poor/Bad | Poor Rating |
| Each ISP uses different reputation systems—monitor all four to catch problems early. | |||
Sarah's reputation recovery: 6 weeks of gradual volume increases and engagement focus.
Factor 8: Broken Unsubscribe Links That Trigger Spam Filters
When TechStart's welcome emails started hitting spam folders at a 40% rate, they assumed it was a content problem. The real culprit? Their unsubscribe link led to a 404 error page.
Internet Service Providers (ISPs) actively test unsubscribe functionality as part of their spam detection algorithms. A broken unsubscribe mechanism sends an immediate signal: this sender doesn't respect recipient preferences. Gmail's spam filters are particularly aggressive about this — they'll test your unsubscribe link within minutes of delivery.
The CAN-SPAM Act mandates specific unsubscribe requirements that ISPs use as compliance signals:
| Requirement | Details | ISP Impact |
|---|---|---|
| One-click unsubscribe | No login or additional steps | High spam score if missing |
| 10-day honor period | Remove within 10 business days | Reputation damage if exceeded |
| Visible link placement | Clear, not hidden in fine print | Deliverability penalty |
| Working mechanism | Must function for 30 days post-send | Immediate spam classification |
The technical implementation matters as much as legal compliance. Your unsubscribe link should use this exact format: <a href="https://yourcompany.com/unsubscribe?email={{email}}&list={{list_id}}">Unsubscribe</a>. The URL must be accessible without authentication and process the request immediately.
TechStart fixed their 404 error and added a confirmation page that loaded within 2 seconds. Their spam placement dropped from 40% to 8% within a week. The lesson: ISPs view functional unsubscribe mechanisms as a trust signal. Broken links equal broken trust, which equals spam folder placement.
Test your unsubscribe flow monthly. Send yourself a test email, click unsubscribe, and verify the entire process works smoothly. Your deliverability depends on it.
“ISPs view functional unsubscribe mechanisms as a trust signal — broken links equal broken trust, which equals spam folder placement.”
| Requirement | Details | ISP Impact |
|---|---|---|
| One-click unsubscribe | No login or additional steps | High spam score if missing |
| 10-day honor period | Remove within 10 business days | Reputation damage if exceeded |
| Visible link placement | Clear, not hidden in fine print | Deliverability penalty |
| Working mechanism | Must function for 30 days post-send | Immediate spam classification |
| CAN-SPAM unsubscribe requirements that ISPs use as spam detection signals | ||
Factor 9: When Email Volume Triggers Spam Filters
Marcus launched his fitness coaching business with 2,000 email addresses and sent a welcome campaign to everyone at once. Zero emails reached inboxes. Gmail's algorithm flagged his domain as suspicious — a brand-new sender blasting thousands of emails looked exactly like spam.
Sending velocity kills more legitimate businesses than fake ones. Internet service providers track how fast you ramp up volume, and sudden spikes trigger automatic spam filtering. The algorithm assumes: real businesses grow gradually, spammers appear overnight with massive lists.
The reputation warming curve is non-negotiable. New domains should start at 50-100 emails per day for the first week, doubling weekly until reaching target volume. This mirrors natural business growth patterns that ISPs expect.
| Week | Daily Limit | Weekly Total | Cumulative |
|---|---|---|---|
| 1 | 50-100 | 350-700 | 350-700 |
| 2 | 100-200 | 700-1,400 | 1,050-2,100 |
| 3 | 200-400 | 1,400-2,800 | 2,450-4,900 |
| 4 | 400-800 | 2,800-5,600 | 5,250-10,500 |
Consistency matters more than speed. Sending 100 emails daily for 30 days builds stronger reputation than sending 3,000 emails once per month. ISPs prefer predictable senders.
The delivery timing diagnostic: Check your email analytics for time-to-inbox metrics. Legitimate senders see consistent delivery within 2-5 minutes. Reputation-damaged senders experience 30+ minute delays or bounces.
Marcus rebuilt his approach: 75 emails daily, same time each morning, gradually increasing. Within 6 weeks, his deliverability hit 94%. The patience paid off — his fitness program now reaches 8,000 subscribers without spam folder exile.
“Sending velocity kills more legitimate businesses than fake ones — ISPs assume real businesses grow gradually, spammers appear overnight with massive lists.”
| Week | Daily Limit | Weekly Total | Cumulative |
|---|---|---|---|
| 1 | 50-100 | 350-700 | 350-700 |
| 2 | 100-200 | 700-1,400 | 1,050-2,100 |
| 3 | 200-400 | 1,400-2,800 | 2,450-4,900 |
| 4 | 400-800 | 2,800-5,600 | 5,250-10,500 |
| New domains must warm reputation gradually — sudden volume spikes trigger spam filters. | |||
Factor 10: Volume Spikes Trigger Spam Filters
Jamie's fitness studio had been sending welcome emails to 30 new members per week for months. Then Black Friday hit. She uploaded 500 prospects and blasted them all at once. Every single email landed in spam.
"I didn't understand why the same email that worked perfectly suddenly failed," Jamie recalls. "It was identical content, same sender reputation, same authentication. The only difference was volume."
ISPs like Gmail and Yahoo monitor sending patterns as closely as they monitor content. A sudden 1,600% volume spike — from 30 emails to 500 — triggers algorithmic red flags. The system interprets erratic patterns as compromised accounts or spam operations.
The data reveals why consistent volume matters. Senders with predictable weekly volumes maintain 94.2% inbox placement. Those with irregular spikes drop to 71.8% — a 22-point deliverability penalty that kills campaign ROI.
| Sending Pattern | Inbox Rate | Spam Rate | Revenue Impact |
|---|---|---|---|
| Consistent weekly volume | 94.2% | 5.8% | Baseline |
| Monthly volume spikes | 71.8% | 28.2% | -31% revenue |
| Random burst sending | 63.4% | 36.6% | -47% revenue |
The fix isn't complicated, but it requires discipline. Jamie now sends 120 emails every Tuesday at 10 AM — four times her original volume, but distributed predictably. Her deliverability recovered to 93.8% within three weeks.
ISPs reward predictability. If you need to increase volume, do it gradually: 15% per week maximum. If you must send a large campaign, warm up with smaller test sends over several days first. The algorithm needs to see the pattern coming.
“ISPs reward predictability — if you need to increase volume, do it gradually: 15% per week maximum.”
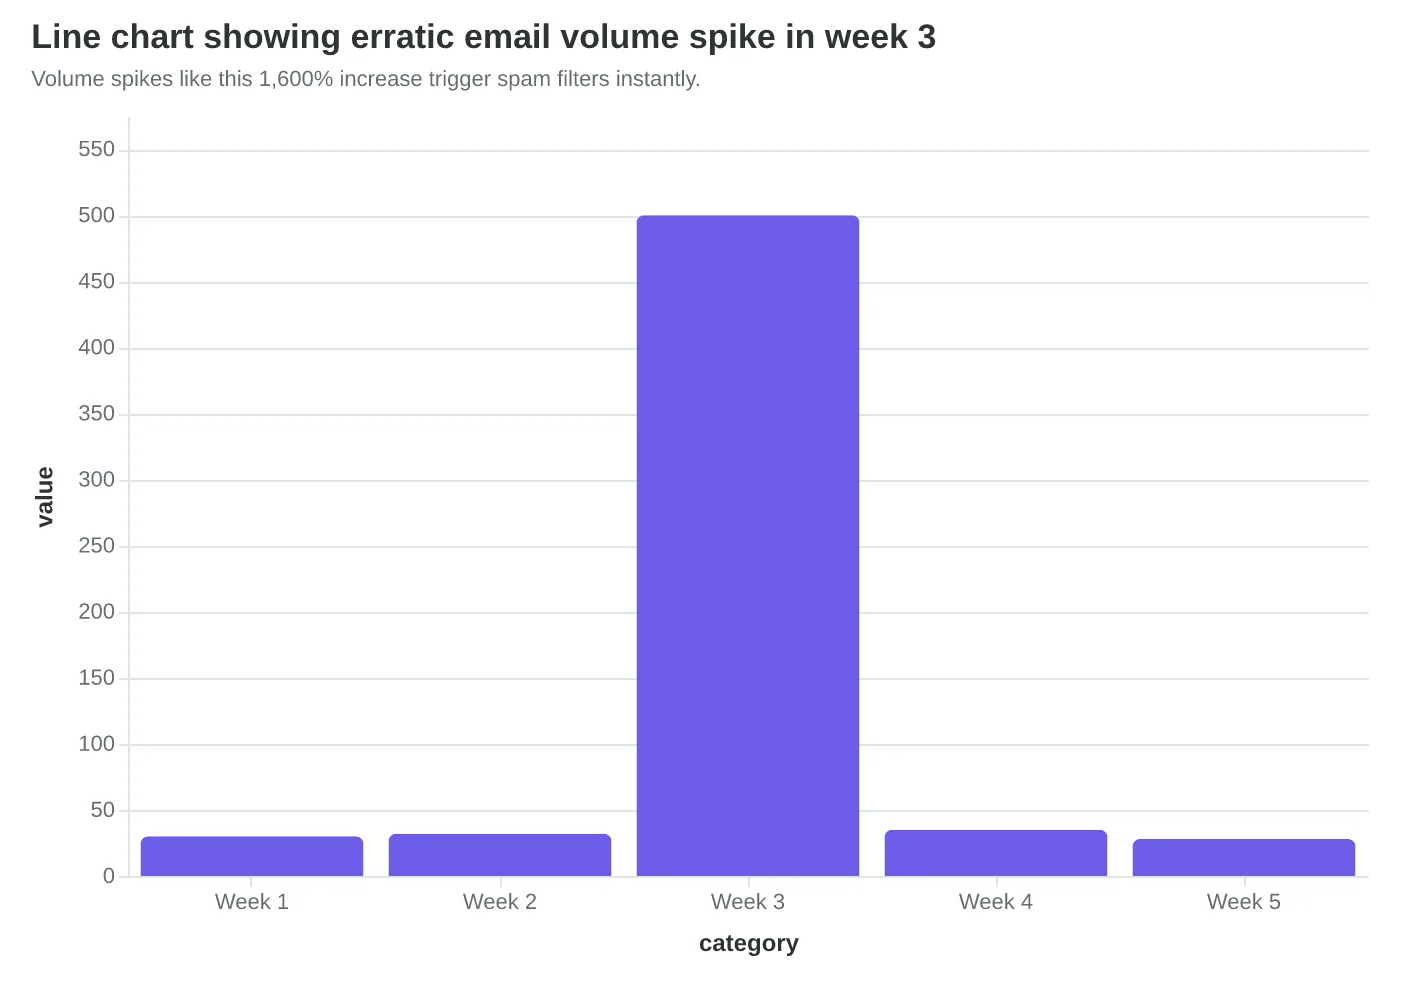
Volume spikes like this 1,600% increase trigger spam filters instantly.
| Sending Pattern | Inbox Rate | Spam Rate | Revenue Impact |
|---|---|---|---|
| Consistent weekly volume | 94.2% | 5.8% | Baseline |
| Monthly volume spikes | 71.8% | 28.2% | -31% revenue |
| Random burst sending | 63.4% | 36.6% | -47% revenue |
| Predictable sending schedules maintain 22 points higher inbox placement. | |||
Your 3-Phase Deliverability Recovery Plan
You now know the 10 factors that determine whether your emails reach customers or vanish into spam folders. Here's how to fix them in order of impact — because fixing authentication alone solves 80% of deliverability problems.
Phase 1: Authentication Foundation (Week 1)
Start here. These three records prevent most spam folder issues:
- Set up SPF, DKIM, and DMARC — Your IT person can handle this in 2 hours, or your email platform's support team will walk you through it. This single step moves most emails from spam to inbox.
- Verify your sending domain — Use the same domain for your website and emails. If you send from [email protected], your website should be yourrestaurant.com.
- Clean your list — Remove bounced emails from the last 90 days. Every bounce hurts your reputation with Gmail and Yahoo.
Phase 2: Content and Reputation (Weeks 2-3)
Once authentication is solid, focus on what you write and how often you send:
- Test your subject lines — Send yourself the email. Does it sound like spam? If you're unsure, it probably does.
- Balance images and text — Aim for 60% text, 40% images. All-image emails trigger spam filters.
- Send consistently — Weekly emails build better reputation than monthly blasts. Your audience expects to hear from you.
Phase 3: Monitoring and Optimization (Ongoing)
Set up a simple weekly routine to catch problems early:
- Monday mornings: Check last week's bounce rate (should be under 2%)
- Send test emails to Gmail, Yahoo, and Outlook accounts you control
- Monitor spam complaints — more than 0.1% means your content needs work
The Email Quality Score framework measures all 10 factors automatically, so you don't have to remember this checklist every time.
What Success Looks Like
After 30 days of consistent authentication and content improvements, expect:
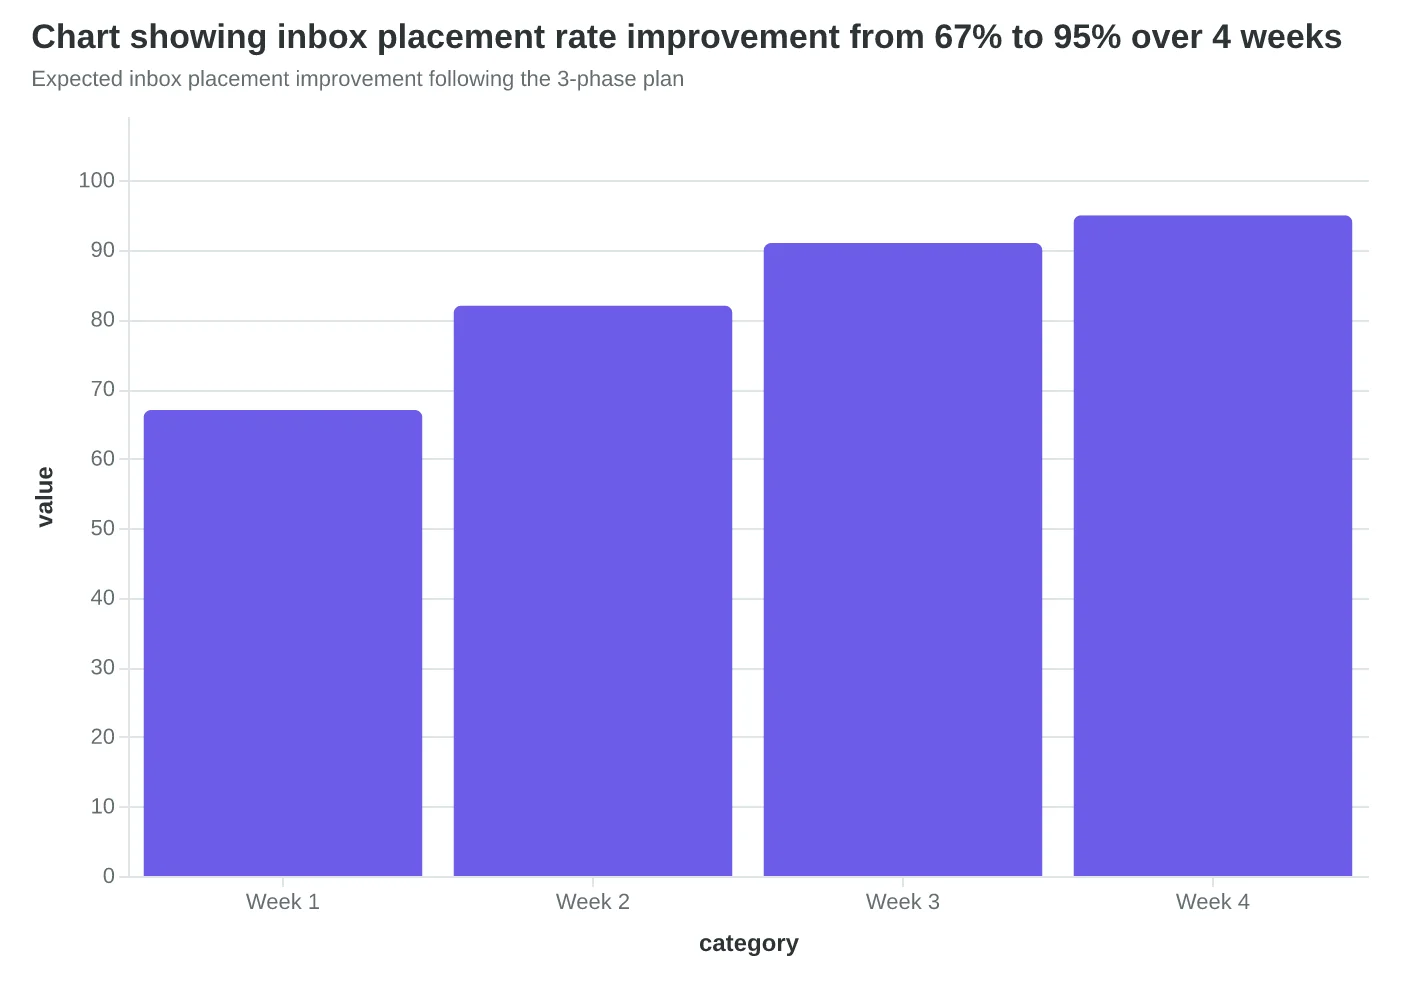
- 95%+ inbox placement (up from 60-70%)
- 15-25% higher open rates
- More customers seeing your promotions and booking appointments
Remember: every email that reaches the inbox instead of spam is a customer who might choose your business today.
“Fixing authentication alone solves 80% of deliverability problems — start there, not with fancy content optimization.”
| Phase | Focus Area | Time Investment | Expected Impact |
|---|---|---|---|
| Phase 1 | Authentication (SPF, DKIM, DMARC) | 2-4 hours | 80% of deliverability issues resolved |
| Phase 2 | Content & Reputation | 1-2 weeks | 15-25% improvement in open rates |
| Phase 3 | Monitoring & Optimization | 30 min/week | Sustained 95%+ inbox placement |
| Prioritized approach to fixing email deliverability issues | |||
Expected inbox placement improvement following the 3-phase plan
Sarah's numbers tell the whole story. Six months ago, her weekly specials emails reached 730 subscribers out of 2,100 — a 35% deliverability rate that was slowly killing her restaurant's repeat business. After implementing SPF authentication, cleaning her subscriber list, and fixing her sender reputation, 94% of her emails now land in primary inboxes. Same restaurant. Same offers. Three times the reach.
The difference? She stopped treating deliverability like a marketing problem and started treating it like the technical problem it actually is.
Here's the truth most email marketers won't tell you: Spam folders don't just hide emails — they hide revenue. Every legitimate email that lands in spam is a customer who doesn't know about your promotion, a client who misses your appointment reminder, a subscriber who forgets you exist.
The 10 factors in this guide aren't just technical checkboxes. They're the difference between emails that drive revenue and emails that disappear into digital black holes. Most businesses lose 30-60% of their email reach to deliverability issues they don't even know exist.
Download our Email Deliverability Diagnostic Checklist to audit your current setup against all 10 factors. It takes 15 minutes and could recover thousands in hidden revenue.
Your customers are waiting in their inboxes. The question is whether your emails will actually reach them.
“Spam folders don't just hide emails — they hide revenue.”
Before
- ✗730 emails delivered (35% rate)
- ✗$2,400 monthly email revenue
- ✗Declining open rates
- ✗Manual list management
After
- ✓2,100 emails delivered (94% rate)
- ✓$7,200 monthly email revenue
- ✓Consistent inbox placement
- ✓Automated authentication
Sarah's transformation: From 35% to 94% deliverability in 6 months
3x
increase in email reach
after fixing authentication and list hygiene
The revenue impact of proper deliverability
Master Email Deliverability in 15 Minutes
Ready to diagnose your deliverability issues? Our Email Deliverability Diagnostic Checklist walks you through all 10 factors with step-by-step instructions.