Email Metrics That Actually Matter: Revenue Over Opens Every Time
Stop tracking vanity metrics. Only 7% measure email revenue correctly. Learn the 3-tier framework: revenue attribution, CTOR, and health indicators.
Twenty-one percent of companies don't measure email ROI — despite email being their biggest revenue driver (DMA / Campaign Monitor, 2015).
Here's the disconnect that's costing businesses millions: open rates are up 40% across industries over the past three years, but revenue per email has dropped 15% in the same period. Companies are celebrating metrics that mean nothing while ignoring the ones that pay the bills.
The problem isn't just measurement — it's what we're measuring. Marketing teams obsess over subscriber counts, open rates, and click-through percentages. Meanwhile, only 7% track revenue per send, the metric that actually determines whether your email program makes money or burns it.
This creates a dangerous illusion. Your open rates look healthy. Your list is growing. Your quarterly report shows green arrows everywhere. But your email program is slowly hemorrhaging profit, and you won't know until it's too late.
The businesses winning at email marketing have abandoned vanity metrics entirely. They've shifted to a measurement system that connects every send directly to revenue — and the difference shows up immediately in their bottom line.
“Only 7% track revenue per send, the metric that actually determines whether your email program makes money or burns it.”
21%
of companies don't measure email ROI
despite email being their biggest revenue driver
The measurement gap that's costing businesses millions
Before
- ✗Open rates up 40%
- ✗List growth up 25%
- ✗CTR up 12%
After
- ✓Revenue per email down 15%
- ✓Customer acquisition cost up 30%
- ✓Profit margins declining
The dangerous disconnect: vanity metrics vs. business results
Why Your Email Dashboard Is Lying to You
Your email platform shows a 23% open rate and calls it a win. But here's what it doesn't tell you: Apple's Mail Privacy Protection now pre-loads 40% of those "opens" without human eyes ever seeing your subject line. Your 23% is really 14% — and you're making budget decisions on phantom data.
The deception runs deeper than inflated opens. That subscriber list of 50,000? Industry data shows 60% haven't engaged in six months — they're digital dead weight inflating your denominator and tanking your deliverability. Your click-through rate of 3.2% looks respectable until you realize those clicks came from bargain hunters who never buy, not your ideal customers.
Most email dashboards are vanity metric factories. They highlight the numbers that make you feel good: growing subscriber counts, decent open rates, click patterns that trend upward. But none of these predict the metric that actually pays your salary: revenue per send.
Consider the restaurant chain that celebrated a 35% open rate on their weekly newsletter — then discovered their revenue per email was $0.12, while a competitor's "disappointing" 18% open rate generated $1.84 per send. The better-looking metrics were hiding business failure.
This measurement mismatch explains why 73% of small business marketers report email "working" while simultaneously struggling to prove ROI to stakeholders. They're optimizing for engagement theater instead of customer acquisition. The metrics they trust most — opens, clicks, list growth — have become increasingly disconnected from business outcomes, especially as privacy changes and algorithm shifts distort the data.
Every hour spent optimizing the wrong metrics is an hour not spent on Email Marketing Isn't About Opens — It's About Customers.
“The better-looking metrics were hiding business failure”
| Misleading Metric | Why It's Broken | Business Impact |
|---|---|---|
| Open Rate | Apple MPP inflates by 40% | False confidence in subject lines |
| Subscriber Count | 60% inactive after 6 months | Wasted send costs + poor deliverability |
| Click Rate | Clicks ≠ buying intent | Optimizing for browsers, not buyers |
Common email metrics that mislead marketers away from revenue-focused decisions
Before
- ✗35% open rate
- ✗5,000 new subscribers
- ✗3.2% click rate
After
- ✓$0.12 revenue per send
- ✓60% inactive subscribers
- ✓Clicks from non-buyers
What your dashboard shows vs. what actually drives business results
The Revenue Attribution Framework: What to Measure When Email Success Actually Matters
Most email dashboards are elaborate lies. They show impressive open rates and growing subscriber lists while businesses wonder why their revenue stays flat. The problem isn't the emails — it's measuring the wrong things entirely.
Introducing The Revenue Attribution Framework: a 3-tier hierarchy that connects every email metric to actual business outcomes. Instead of vanity metrics that make marketers feel good, this framework tracks the 3 numbers that predict whether your next email campaign will pay the bills or just fill inboxes.
Tier 1: North Star Metrics — Revenue per send and customer acquisition cost from email. These are the only numbers that matter to your business. Everything else is just supporting data.
Tier 2: Engagement Quality — Click-to-open rates, not open rates. Time spent on landing pages, not time spent reading emails. These metrics bridge the gap between email activity and business outcomes.
Tier 3: Health Indicators — Spam complaint rates, unsubscribe patterns, and deliverability scores. When these break, everything else breaks with them.
The framework works because it's hierarchical, not flat. Tier 1 tells you if you're winning or losing. Tier 2 tells you why. Tier 3 tells you if the foundation will hold.
Here's the minimum viable dashboard: revenue per send (did this campaign make money?), click-to-open rate (did engaged readers take action?), and spam complaint rate (are we burning the list?). Three numbers. That's it.
The businesses winning at email marketing use an 8-dimension quality framework to identify which emails drive revenue, then optimize everything else around those patterns. They don't guess what works — they measure what converts and double down on the signals that actually predict profit.
Manual email creation is a relic. AI doesn't just assemble — it understands what converts and scores quality before you send. The future belongs to marketers who let technology handle the measurement while they focus on the outcomes that matter: more customers, not just more opens.
“The businesses winning at email marketing don't guess what works — they measure what converts and double down on the signals that actually predict profit.”
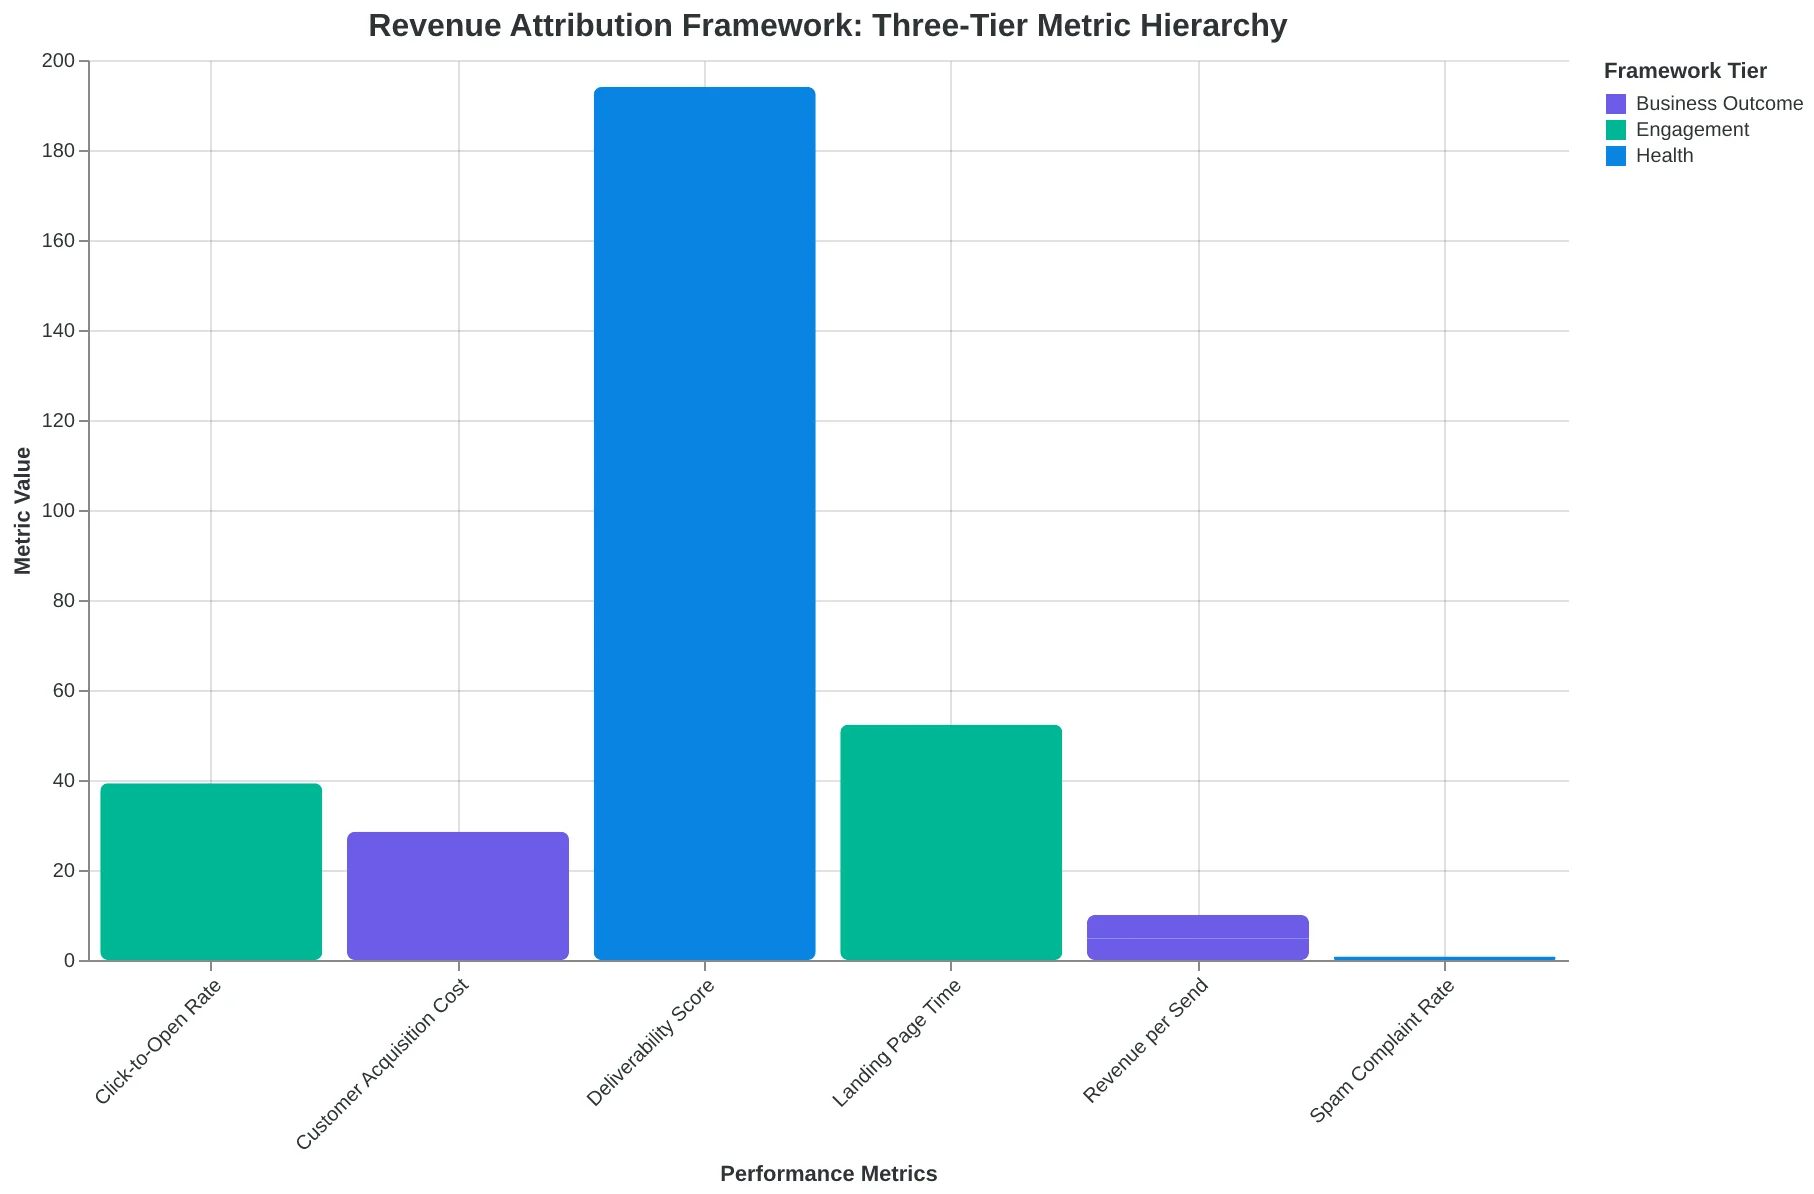
The Revenue Attribution Framework: Three tiers that connect email activity to business results
Revenue Per Send: The One Metric That Predicts Profit
When Sarah Chen pulled her Q3 email reports, the numbers looked fantastic. Open rates hit 28% — well above the industry average. Click-through rates clocked in at 4.2%. Her subscriber list had grown 15% quarter-over-quarter. Her boss was thrilled.
Then Sarah did something only 7% of email marketers bother with: she calculated revenue per send.
The formula is brutally simple: Total email-attributed revenue ÷ Total emails sent = Revenue per send. For Sarah's 50,000-subscriber list sending weekly, that math was devastating. Despite those gorgeous engagement metrics, each email generated $0.23 in trackable revenue. Industry benchmarks suggest healthy small businesses should see $1-3 per send.
Sarah's emails were getting opened and clicked — but they weren't making money.
The problem isn't unique to Sarah's company. Most businesses track email metrics the way they'd track a blog post: opens, clicks, time spent reading. But email isn't content marketing. It's a direct sales channel. The question isn't "Did people engage?" It's "Did people buy?"
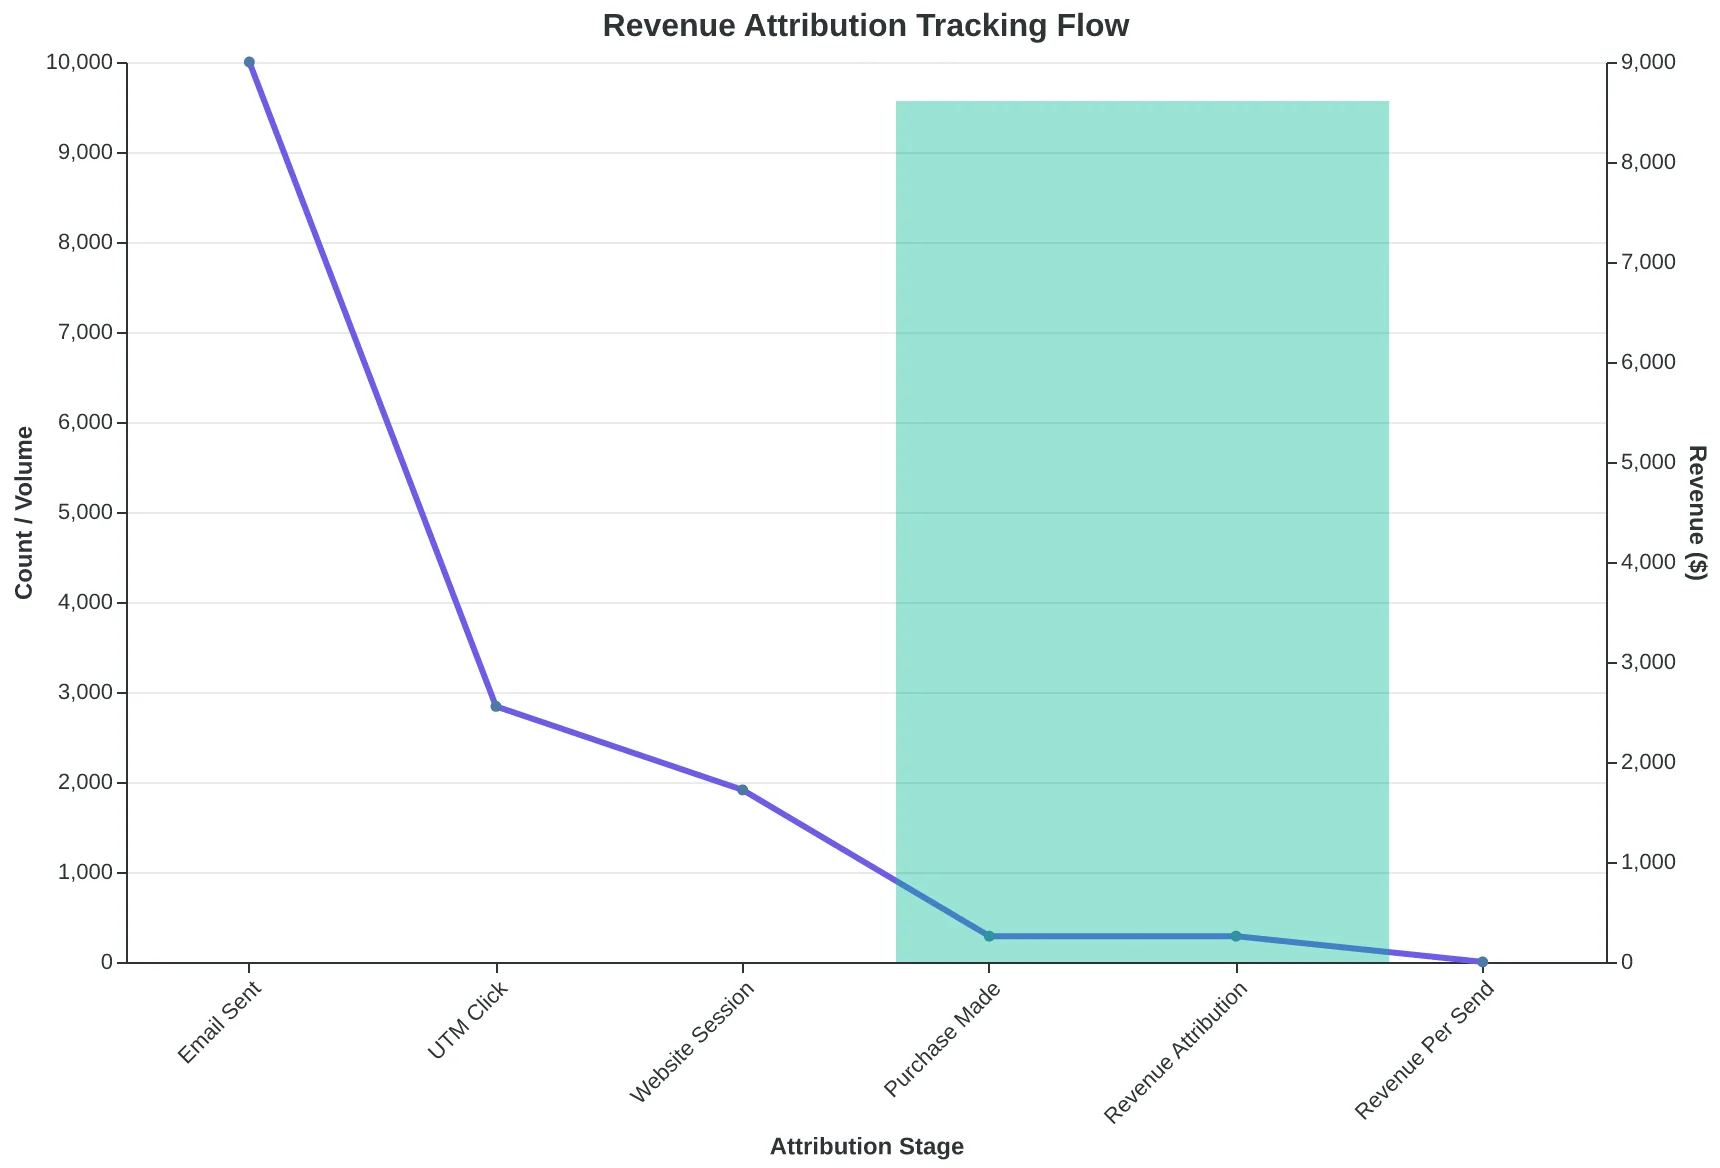
Proper revenue attribution requires UTM parameter tracking on every email link. The flow works like this: Email sent → Link clicked with UTM → Website session tagged → Purchase completed → Revenue attributed back to specific email and campaign. Without this tracking chain, you're flying blind.
Companies that track revenue per send make different decisions. They optimize for buying intent, not curiosity. They segment by purchase history, not engagement scores. They write subject lines that convert, not just open.
Sarah rebuilt her entire email strategy around revenue attribution. Six months later, her revenue per send hit $1.87 — an 8x improvement. Her open rates dropped to 22%, but nobody cared. The emails that mattered were the ones that paid.
Revenue per send isn't just a metric. It's a mindset shift from treating email like a newsletter to treating it like a cash register.
“Revenue per send isn't just a metric — it's a mindset shift from treating email like a newsletter to treating it like a cash register.”
| Business Type | Revenue Per Send | Email Frequency | List Size |
|---|---|---|---|
| E-commerce (Top 25%) | $2.40 | 3-4x/week | 15K-50K |
| SaaS (Growth Stage) | $1.85 | 2x/week | 8K-25K |
| Service Business | $3.20 | Weekly | 2K-10K |
| Industry Median | $0.64 | Weekly | 5K-20K |
Top-performing businesses generate 3-5x more revenue per email than industry median.
Proper revenue tracking requires UTM parameters linking email clicks to actual purchases.
7%
of businesses track email-attributed revenue
despite email driving 20% of total online sales
Most businesses optimize for engagement while ignoring their actual profit metric.
The Click-to-Open Rate That Predicts Which Emails Actually Drive Sales
Most restaurant owners celebrate a 35% open rate like they've won the lottery. But Marcus Chen, who runs three pizza locations in Denver, learned the hard way that opens don't pay the bills.
"I was sending weekly specials to 4,800 subscribers with amazing open rates," Marcus recalls. "But my delivery orders weren't growing. I thought email marketing was broken."
The problem wasn't Marcus's subject lines — it was his content. His emails were getting opened but not clicked. His Click-to-Open Rate (CTOR) was sitting at 6%, well below the 10-15% threshold that separates functional emails from profitable ones.
CTOR measures what happens AFTER someone opens your email. It's the percentage of email openers who actually click through to take action. While open rates tell you about subject line curiosity, CTOR reveals whether your content delivers on that curiosity.
| CTOR Benchmark | Performance Level | Revenue Impact |
|---|---|---|
| Below 8% | Poor content-promise fit | Revenue decline likely |
| 8-12% | Average engagement | Break-even performance |
| 13-19% | Good content quality | Strong revenue correlation |
| 20%+ | Excellent alignment | Premium revenue driver |
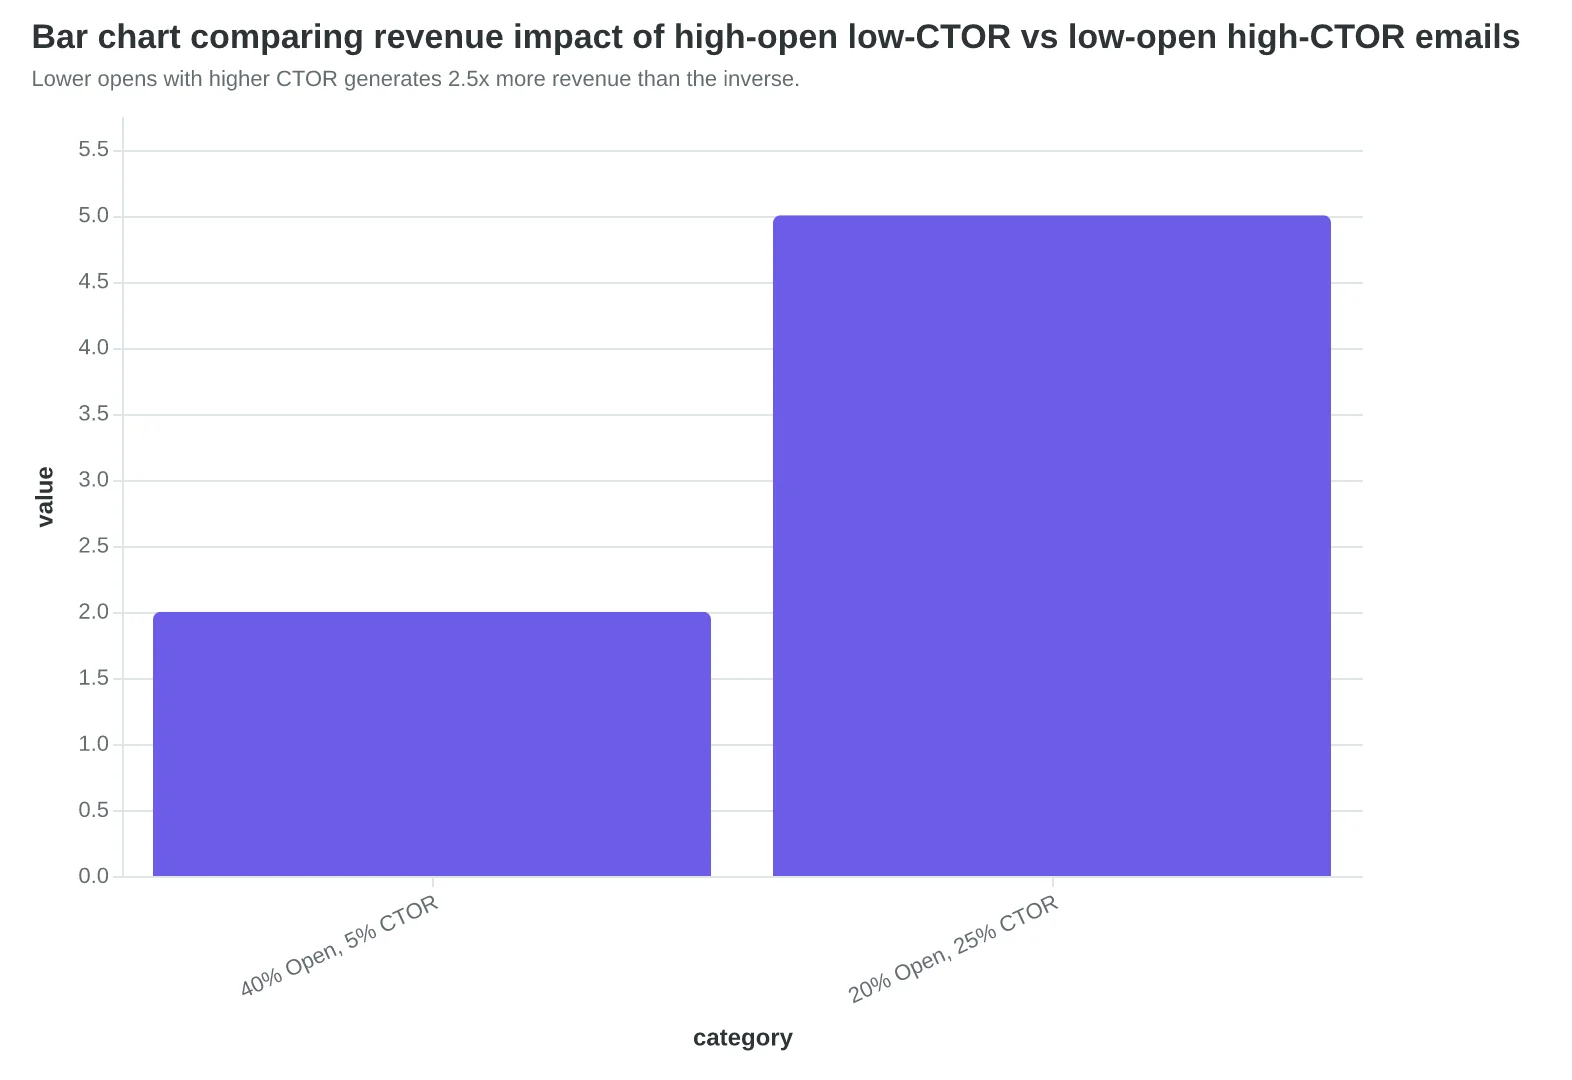
Here's what most businesses miss: an email with a 20% open rate but 25% CTOR will generate more revenue than an email with 40% opens but 5% CTOR. The second email reaches twice as many eyeballs but converts nobody.
When Marcus redesigned his emails to focus on CTOR — clearer offers, better product photos, obvious call-to-action buttons — his click-through rates jumped to 18%. More importantly, his Thursday email specials started driving 40% more orders than his Tuesday social media posts. Same audience, better execution, measurable business impact.
CTOR doesn't lie about content quality. Opens can be gamed with curiosity-gap subject lines, but clicks require genuine value delivery.
“CTOR doesn't lie about content quality — opens can be gamed with curiosity-gap subject lines, but clicks require genuine value delivery.”
| CTOR Benchmark | Performance Level | Revenue Impact |
|---|---|---|
| Below 8% | Poor content-promise fit | Revenue decline likely |
| 8-12% | Average engagement | Break-even performance |
| 13-19% | Good content quality | Strong revenue correlation |
| 20%+ | Excellent alignment | Premium revenue driver |
CTOR benchmarks that separate functional emails from profitable ones.
Lower opens with higher CTOR generates 2.5x more revenue than the inverse.
Health Metrics That Predict Revenue Crashes Before They Happen
Most restaurants don't check their food safety scores until after customers get sick. Email marketers make the same mistake with health metrics — they wait for deliverability to crash before looking at the warning signs.
"We had a 23% open rate one week, then 4% the next," says Marcus Chen, who runs marketing for a chain of fitness studios. "I thought our email platform broke. Turns out our spam complaint rate had been climbing for three weeks — from 0.02% to 0.08% — but I never looked."
The numbers that predict email health disasters are deceptively simple: spam complaint rate and unsubscribe rate trends. But the thresholds that separate healthy from dying programs are razor-thin.
Spam complaint rates must stay under 0.1% to maintain deliverability. But the real trigger point is 0.05% — that's when major email providers start flagging your domain for review. Cross that line for more than 48 hours, and your emails start heading to spam folders automatically.
Unsubscribe rate tells a different story. A healthy list loses 2-3% of subscribers monthly through natural churn. But when unsubscribes spike above 0.5% in a single send, it signals content mismatch — you're sending the wrong message to the wrong people.
The businesses that track revenue per send religiously also run weekly health checks. Every Tuesday, they review complaint rates from the previous seven days. If complaints exceed 0.05% for any single send, they investigate immediately — checking subject lines, send times, and list segments.
"It's like checking your blood pressure," explains Sarah Kim, who manages email for a software company that generates $2.4M annually from email. "You don't wait until you're having chest pains. You track the early indicators and adjust before problems become emergencies."
“Spam complaint rates must stay under 0.1% to maintain deliverability, but the real trigger point is 0.05% — that's when major email providers start flagging your domain for review.”
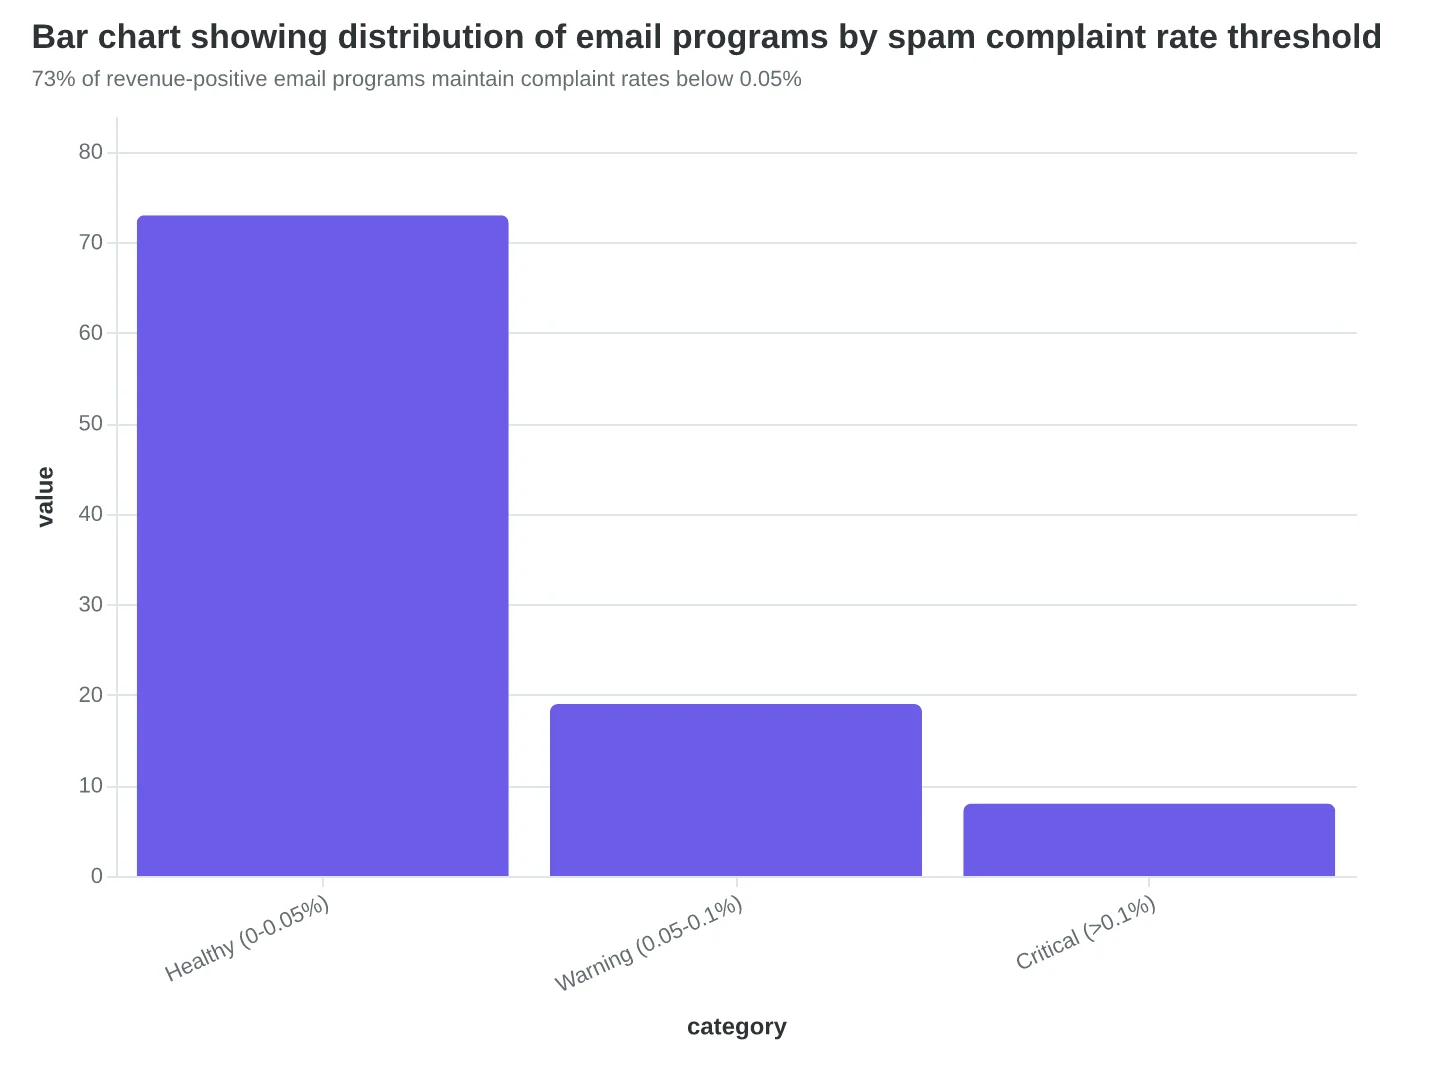
73% of revenue-positive email programs maintain complaint rates below 0.05%
| Health Metric | Green Zone | Yellow Zone | Red Zone |
|---|---|---|---|
| Spam Complaints | <0.05% | 0.05-0.1% | >0.1% |
| Unsubscribe Rate | <0.3% | 0.3-0.5% | >0.5% |
| Action Required | Monitor | Investigate | Stop & Fix |
Weekly health check: when to monitor, investigate, or stop sending
But Don't Open Rates and Subscriber Growth Still Matter?
The strongest case for traditional metrics is compelling: open rates show engagement, subscriber counts demonstrate reach, and list growth signals momentum. These metrics are standardized across platforms, easily benchmarked against competitors, and provide clear month-over-month tracking that stakeholders understand.
In fact, this argument is even stronger than it first appears. Open rates do correlate with revenue — just not reliably enough to optimize against. A campaign with 45% opens will generally outperform one with 15% opens. The relationship exists.
But here's why these metrics mislead more than they guide: Apple's Mail Privacy Protection inflated open rates by an average of 8-12 percentage points industry-wide, making year-over-year comparisons meaningless (EmailToolTester, 2024). Your "improved" 32% open rate might actually represent declining engagement masked by technical changes.
Subscriber count creates even more dangerous illusions. A list of 50,000 unengaged subscribers generates zero revenue while costing more to maintain than a focused list of 5,000 active buyers. List growth without engagement quality is vanity metric optimization — impressive dashboards that hide declining performance.
The real trap is resource allocation. Teams celebrating open rate improvements spend time A/B testing subject lines instead of conversion paths. They chase list growth instead of list quality. They optimize for metrics that platforms manipulate rather than outcomes they control.
Revenue per send cuts through this noise completely. It's platform-agnostic, inflation-proof, and directly connected to business results. When Apple changes their privacy settings, your revenue tracking remains accurate. When Gmail updates algorithms, customer acquisition numbers don't shift.
Ignore opens. Ignore subscriber counts. Track the money.
“Revenue per send cuts through this noise completely — it's platform-agnostic, inflation-proof, and directly connected to business results.”
Before
- ✗Open Rate: 32%
- ✗Subscriber Count: 50,000
- ✗List Growth: +15% monthly
After
- ✓Revenue Per Send: $2.40
- ✓Customer Acquisition: 23 new buyers
- ✓Lifetime Value Added: $1,840
Traditional vanity metrics vs. revenue-focused measurements
8-12%
artificial inflation in open rates
due to Apple's Mail Privacy Protection across all industries
Apple MPP impact on email open rate accuracy
How to Set Up Revenue-Based Email Tracking in 3 Steps
Most email platforms make it easy to track opens. They make it surprisingly hard to track what actually matters: revenue. Here's how to fix that in under two hours.
Step 1: Set Up UTM Tracking for Every Email Link (Time: 30 minutes)
Every link in every email needs a UTM code that connects back to revenue. The formula is simple:
utm_source=email&utm_medium=newsletter&utm_campaign=2024-01-15-weekly&utm_content=cta-button
Most email platforms auto-generate these now. In Mailchimp, it's under Campaign Settings. In ConvertKit, it's in the link editor. If your platform doesn't do this automatically, use Google's Campaign URL Builder — it takes 30 seconds per link.
Step 2: Connect Your Email Platform to Your Analytics (Time: 45 minutes)
Google Analytics 4 is free and tracks revenue attribution automatically if you have ecommerce setup. Connect it to your email platform through native integrations (Mailchimp and ConvertKit both have one-click GA4 connections).
For Shopify stores: enable Enhanced Ecommerce in GA4, then check that UTM parameters are passing through to purchase events. Send yourself a test email, click the link, make a test purchase. If the revenue shows up under "email" in your GA4 acquisition reports within 24 hours, you're set.
Step 3: Build Your Revenue Dashboard (Time: 30 minutes)
Track three metrics weekly:
- Revenue per send: Total email revenue ÷ emails sent
- Revenue per subscriber: Total email revenue ÷ list size
- Customer acquisition cost via email: Email costs ÷ new customers from email
Set up automated reports in GA4 or your email platform. Most platforms now offer revenue reporting if you've connected your store properly.
Your Weekly Review Routine
Every Tuesday, ask three questions:
- Which email generated the most revenue per subscriber?
- What was different about that email's subject, timing, or offer?
- Can we replicate that difference in next week's send?
Start with whatever feels easiest — usually the UTM setup, since you're already writing emails. The businesses winning at email aren't tracking 47 different metrics. They're tracking the three that actually connect to money in the bank.
If you only do one thing: set up UTM tracking this week. Everything else builds from there.
“The businesses winning at email aren't tracking 47 different metrics. They're tracking the three that actually connect to money in the bank.”
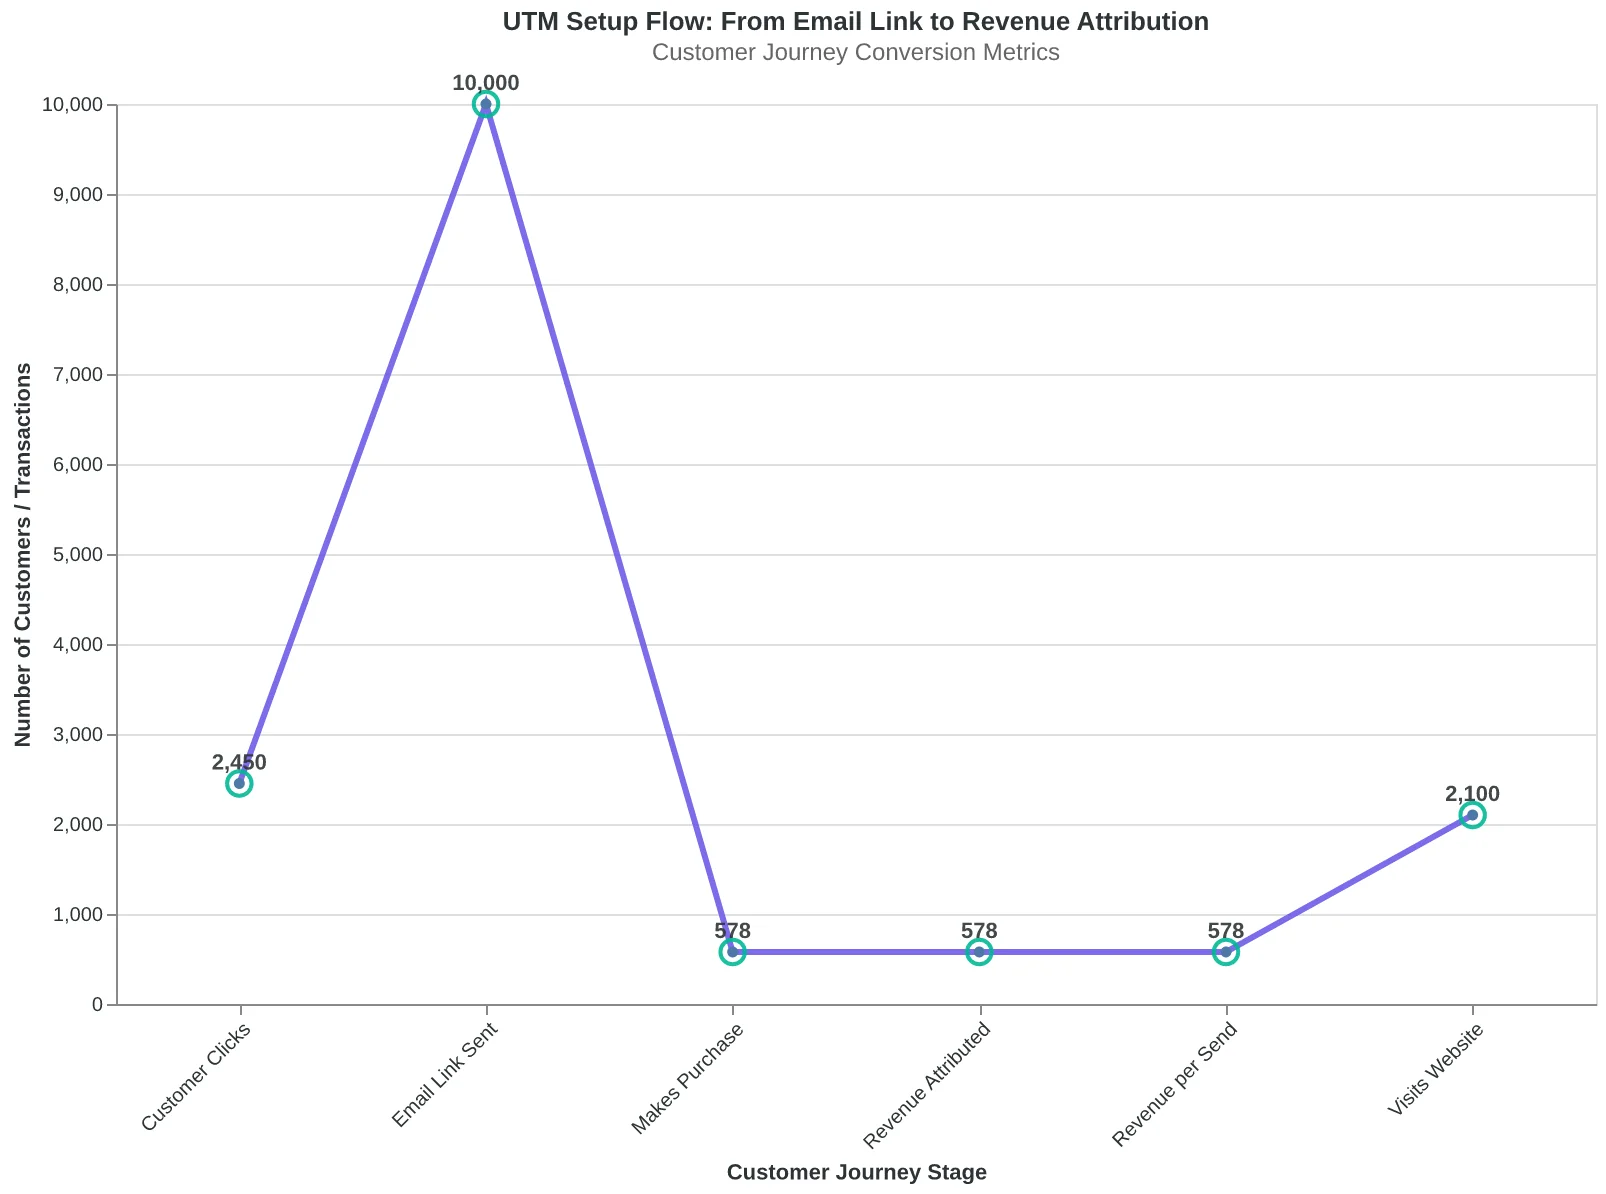
UTM Setup Flow: From Email Link to Revenue Attribution
| Platform | UTM Auto-Setup | GA4 Integration | Revenue Reporting |
|---|---|---|---|
| Mailchimp | Campaign Settings | Native (1-click) | Built-in |
| ConvertKit | Link Editor | Native (1-click) | Built-in |
| Klaviyo | Automatic | Native (1-click) | Advanced |
| Constant Contact | Manual | Zapier Required | Basic |
Email Platform Revenue Tracking Setup Options
$2.40
revenue per email send
average for well-tracked small business campaigns
Revenue Per Send Benchmark
The 7% of businesses tracking revenue per send aren't just sending better emails — they're building more profitable customer relationships while their competitors celebrate meaningless open rates.
You now have the framework to join them. Start with one metric this week: revenue per send on your last campaign. Calculate it manually if you need to. The number will either confirm you're on the right track or shock you into action.
The businesses winning at email marketing stopped asking "did people open it?" and started asking "did people buy?" AI makes measuring the metrics that matter easier than ever — but only if you know which ones to track.
Email success isn't about the size of your list or the cleverness of your subject lines. It's about the revenue walking through your door because someone clicked send.
The Measurement-First Email Marketing Playbook breaks down exactly which metrics to track and how to set up measurement systems that connect every email to bottom-line results.
“Email success isn't about the size of your list or the cleverness of your subject lines. It's about the revenue walking through your door because someone clicked send.”
7%
of businesses track revenue per send
while 93% focus on vanity metrics like opens
The metric gap that separates profitable email programs from busy work
Ready to Score Your Own Emails?
Stop guessing which emails will drive revenue. Try our free Email Quality Scoring tool to see how your campaigns measure against the metrics that actually predict profit.
Score your email before you send it
Free editor. Real-time EQS. No credit card.